
- PRICING
- LIVE QUOTES
- LEARN
- HELP


EN
Scandinavian Investment Group And 2 Other European Penny Stocks To Consider
The European market has recently experienced some turbulence, with the pan-European STOXX Europe 600 Index ending the week down amid concerns over global government bonds and inflationary pressures. Despite these challenges, investors often find opportunities in penny stocks, which refer to smaller or newer companies that can offer significant potential for growth. While the term might seem outdated, these stocks remain a relevant investment area for those looking to explore companies with strong financials and promising prospects.
We'll examine a selection from our screener results.
Scandinavian Investment Group (CPSE:SIG)
Simply Wall St Financial Health Rating: ★★★★☆☆
Overview: Scandinavian Investment Group A/S focuses on investing in real estate properties within Denmark and has a market cap of DKK158.99 million.
Operations: Scandinavian Investment Group A/S does not report specific revenue segments.
Market Cap: DKK158.99M
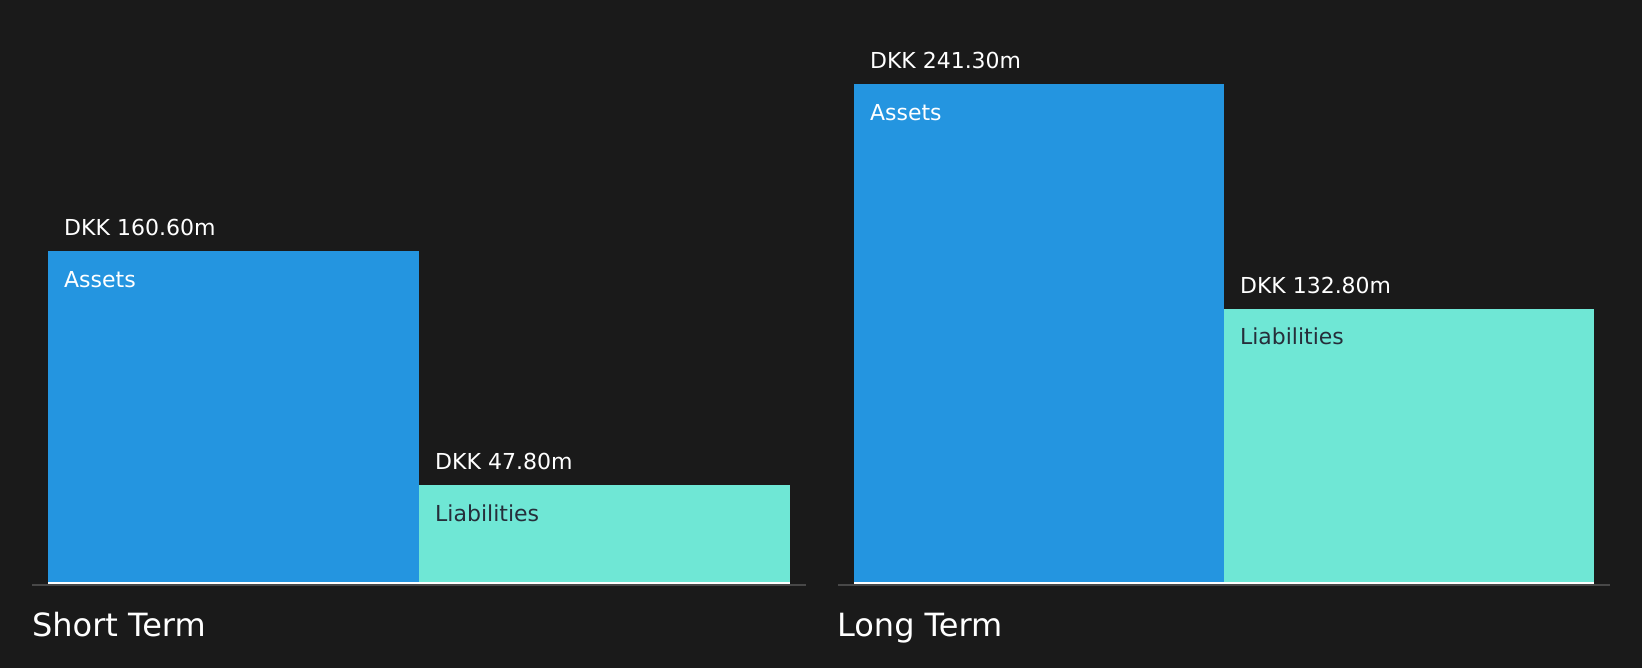
Scandinavian Investment Group A/S recently reported half-year earnings with sales of DKK 8.3 million, up from DKK 6 million the previous year, and net income rising significantly to DKK 23 million. Despite this growth, the company's current net profit margins have slightly decreased compared to last year. The board is experienced with an average tenure of 6.6 years; however, management's experience level remains unclear. SIG's debt levels are satisfactory but not well covered by operating cash flow. While short-term liabilities are well-covered by assets, a large one-off loss has impacted recent financial results. The stock has shown high volatility recently and trades below estimated fair value.
- Click here and access our complete financial health analysis report to understand the dynamics of Scandinavian Investment Group.
- Learn about Scandinavian Investment Group's historical performance here.
Cabka (ENXTAM:CABKA)
Simply Wall St Financial Health Rating: ★★★★★☆
Overview: Cabka N.V. manufactures and sells pallets and large containers made from recycled plastic across Europe, North America, and internationally, with a market cap of €49.42 million.
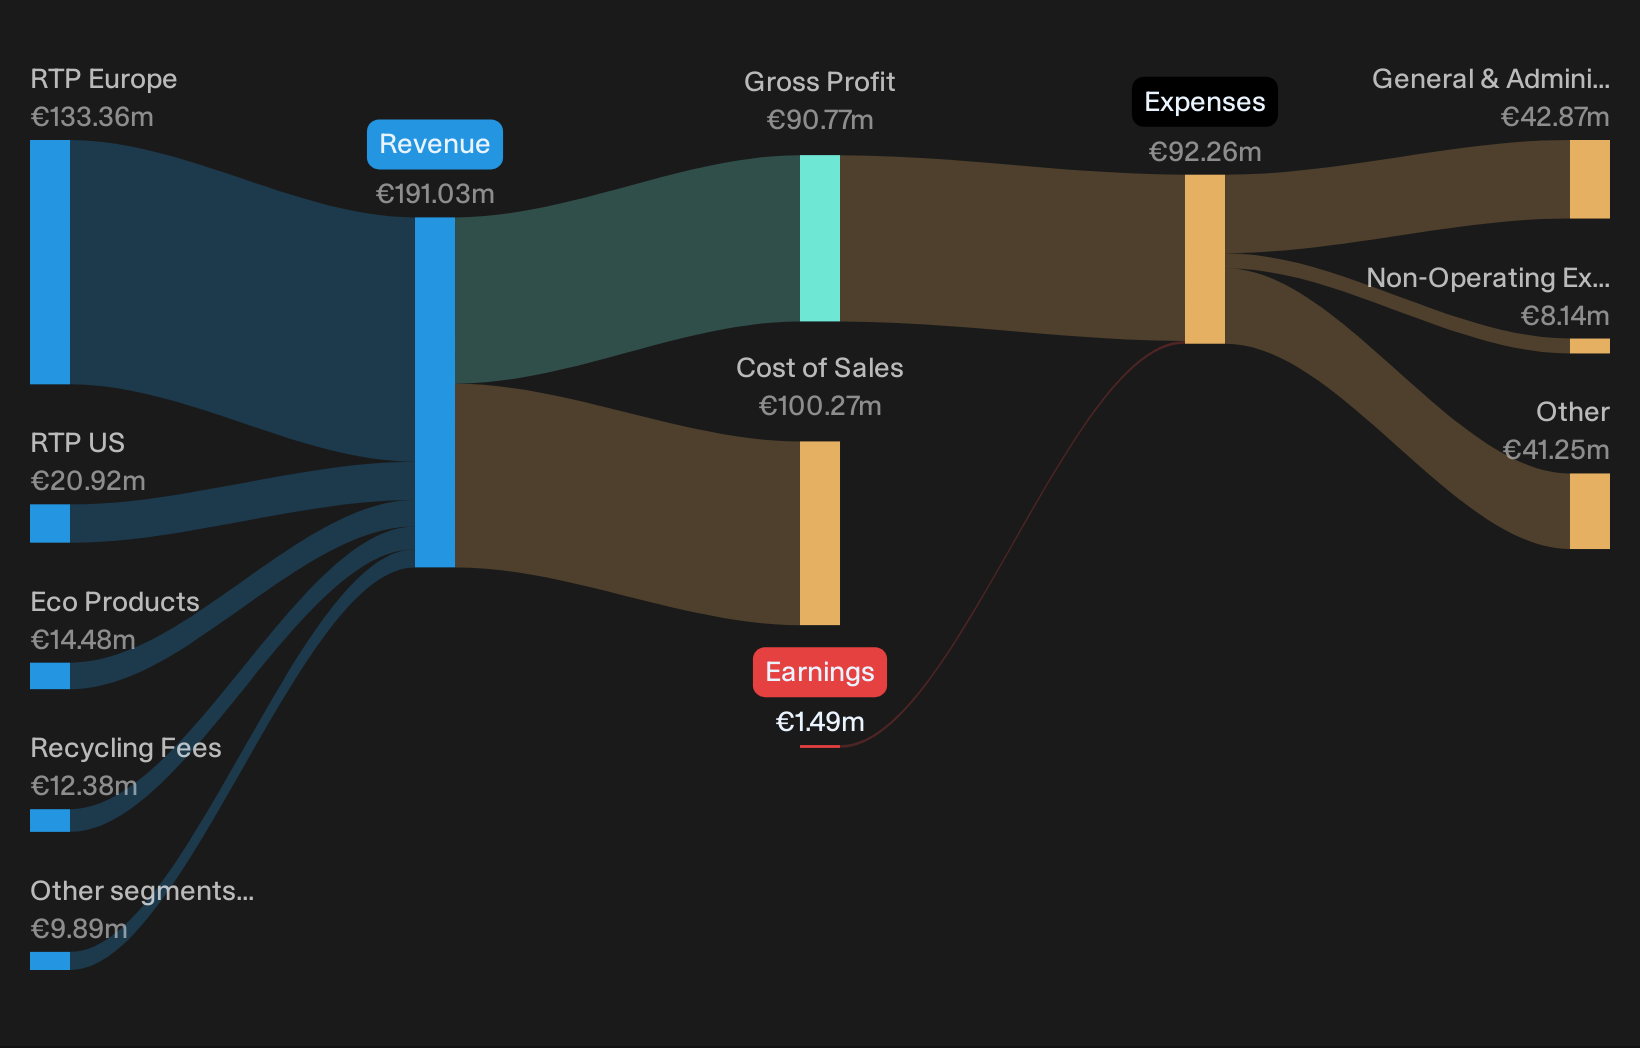
Operations: The company's revenue is primarily derived from RTP Europe (€133.36 million), RTP US (€20.92 million), Eco Products (€14.48 million), and Recycling Fees (€12.38 million).
Market Cap: €49.42M
Cabka N.V. has shown promising financial developments, reporting a revenue increase to €95.8 million for H1 2026 and achieving a net income of €1.2 million, marking an improvement from the previous year's loss. Despite being unprofitable overall, the company has reduced its losses over five years by 13.4% annually and maintains a positive cash flow with a sufficient runway exceeding three years. However, Cabka's high net debt to equity ratio of 122.3% poses some risk, alongside its volatile share price and negative return on equity at -2.9%. The stock trades significantly below estimated fair value but is expected to grow substantially in earnings according to analysts' forecasts.
- Unlock comprehensive insights into our analysis of Cabka stock in this financial health report.
- Learn about Cabka's future growth trajectory here.
Afarak Group (HLSE:AFAGR)
Simply Wall St Financial Health Rating: ★★★★★★
Overview: Afarak Group SE is involved in the extraction, processing, marketing, and trading of specialized metals across Finland, other EU countries, the United States, China, Africa, and internationally with a market cap of €66.40 million.
Operations: The company's revenue is primarily derived from its Speciality Alloys segment, which generated €111.93 million, and its Ferro Alloys segment, contributing €9.23 million.
Market Cap: €66.4M
Afarak Group SE, with a market cap of €66.40 million, reported H1 2026 sales of €57.12 million but faced a net loss of €0.473 million, contrasting last year's net income. Despite being unprofitable and experiencing an annual earnings decline over the past five years, the company has reduced its debt-to-equity ratio significantly to 4.6% and maintains more cash than total debt. Its short-term assets cover both short- and long-term liabilities comfortably, providing a cash runway exceeding three years even as free cash flow shrinks by 12.3% annually. The stock trades well below estimated fair value amid stable weekly volatility.
- Get an in-depth perspective on Afarak Group's performance by reading our balance sheet health report here.
- Assess Afarak Group's previous results with our detailed historical performance reports.

Make It Happen
- Click here to access our complete index of 304 European Penny Stocks.
- Seeking Other Investments? Trump has pledged to "unleash" American oil and gas and these 23 US stocks have developments that are poised to benefit.
This article by Simply Wall St is general in nature. We provide commentary based on historical data and analyst forecasts only using an unbiased methodology and our articles are not intended to be financial advice. It does not constitute a recommendation to buy or sell any stock, and does not take account of your objectives, or your financial situation. We aim to bring you long-term focused analysis driven by fundamental data. Note that our analysis may not factor in the latest price-sensitive company announcements or qualitative material. Simply Wall St has no position in any stocks mentioned.
Have feedback on this article? Concerned about the content? Get in touch with us directly. Alternatively, email editorial-team@simplywallst.com