
- PRICING
- LIVE QUOTES
- LEARN
- HELP


EN
Liberty Energy (LBRT) Pullback Puts Its Undervalued Narrative Back In Focus
Liberty Energy stock reaction and recent performance snapshot
Liberty Energy (LBRT) has traded under pressure recently, with the share price closing at US$20.14. The stock has declined 5% over the past day, 6.7% over the past week, and 16.3% over the past month.
Over the past 3 months, Liberty Energy has fallen 38.7%. The past year reflects a total return of 92.6%. Year to date the stock is up 6.7%, and the 3 year total return is 32.3%.
See our latest analysis for Liberty Energy.
The recent drop in Liberty Energy's share price, including the 1 month share price return of down 16.3% from US$20.14, contrasts sharply with its 1 year total shareholder return of 92.6%. This suggests that recent momentum has faded after a strong run.
If recent volatility in Liberty Energy has you thinking about where else to look in the energy supply chain, this could be a good time to scan 39 power grid technology and infrastructure stocks
Liberty Energy has grown into a sizeable, diversified oilfield services business, yet the share price has swung from a strong 1 year return to a sharp recent pullback. Does the current US$20.14 price still reflect fair value?
Most Popular Narrative: 40.6% Undervalued
The most followed narrative values Liberty Energy at $33.92 per share, well above the last close of $20.14, and frames that gap around power capacity growth and energy demand.
Increased global energy demand, particularly from data centers, industrial reshoring, and emerging markets, continues to drive robust oil and gas and power demand, underpinning enduring utilization for Liberty's core completion services and growing power solutions. This supports sustained or rising revenues and mitigates downside in down cycles.
Read the complete narrative. Read the complete narrative.
Want to see what sits behind that valuation gap? The fair value hinges on revenue expansion, compressed margins, and a forward earnings multiple that is unusually rich for energy services. Curious which specific growth and profitability paths need to line up for that story to hold.
Result: Fair Value of $33.92 (UNDERVALUED)
Have a read of the narrative in full and understand what's behind the forecasts.
However, Liberty Energy's heavy reliance on North American fracturing and the potential softening in completions activity could pressure utilization, margins, and the power upsizing story.
Find out about the key risks to this Liberty Energy narrative.
Another view on Liberty Energy valuation
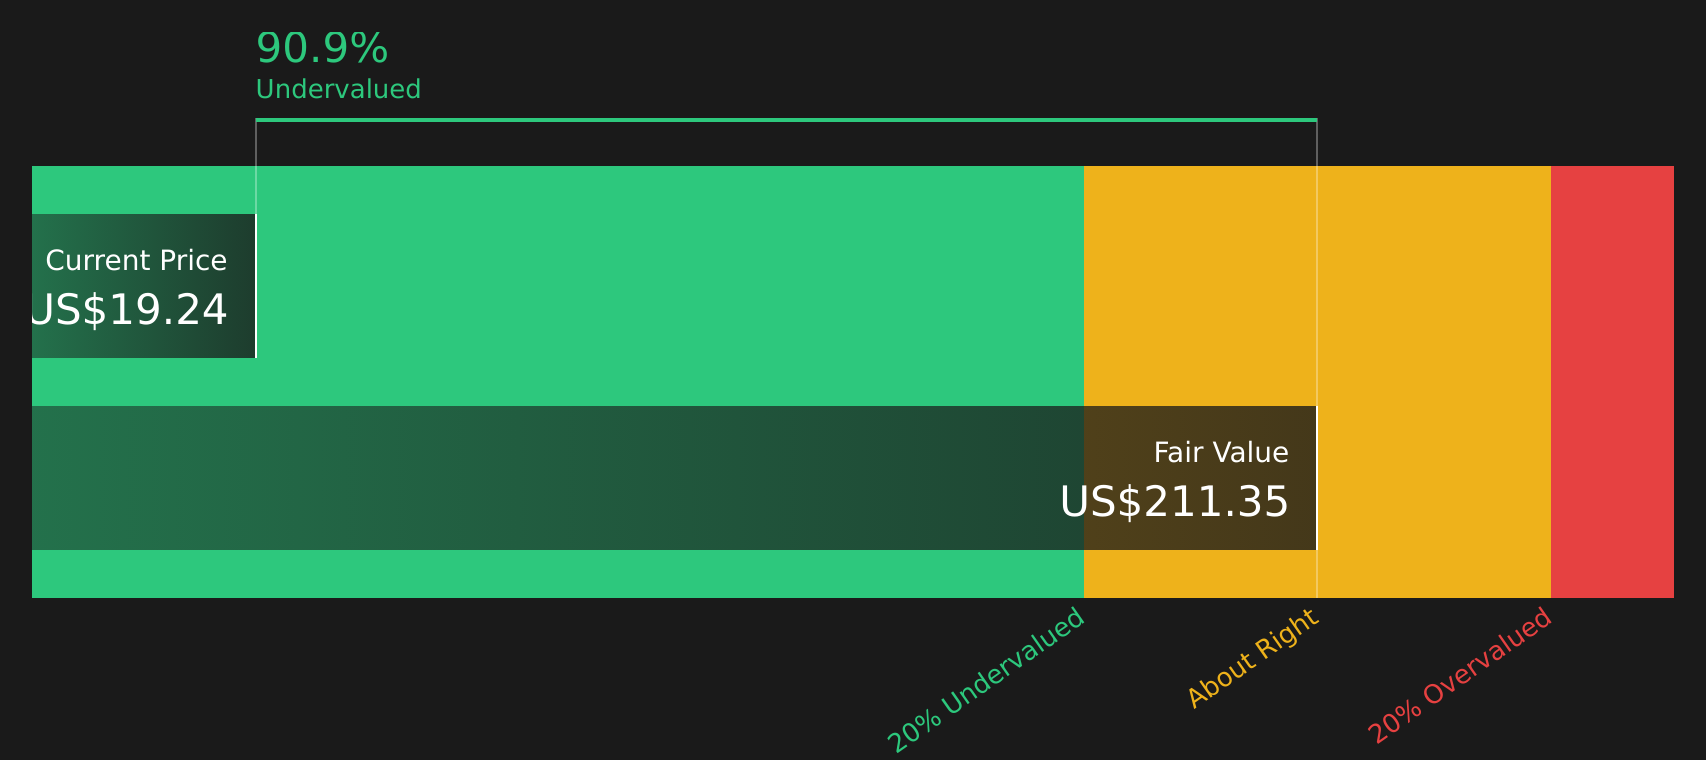
The SWS DCF model paints a very different picture for Liberty Energy. At a share price of US$20.14, the stock is described as trading 90.6% below an estimated future cash flow value of US$213.88, which represents a very large gap for any investor to weigh.
Look into how the SWS DCF model arrives at its fair value.
Next Steps
If the split between risks and rewards around Liberty Energy feels finely balanced, now is a useful moment to check the data yourself and decide where you stand. To see both sides set out clearly, take a look at the 3 key rewards and 4 important warning signs.
Looking for more investment ideas beyond Liberty Energy?
If Liberty Energy has your attention, do not stop there. Broaden your watchlist now so you are not late to the next opportunity.
- Target resilient cash generators that still look overlooked by markets through the 50 high quality undervalued stocks.
- Prioritise stability and downside protection by scanning the 78 resilient stocks with low risk scores.
- Hunt for under-the-radar stocks with strong fundamentals using the screener containing 20 high quality undiscovered gems.
This article by Simply Wall St is general in nature. We provide commentary based on historical data and analyst forecasts only using an unbiased methodology and our articles are not intended to be financial advice. It does not constitute a recommendation to buy or sell any stock, and does not take account of your objectives, or your financial situation. We aim to bring you long-term focused analysis driven by fundamental data. Note that our analysis may not factor in the latest price-sensitive company announcements or qualitative material. Simply Wall St has no position in any stocks mentioned.
Have feedback on this article? Concerned about the content? Get in touch with us directly. Alternatively, email editorial-team@simplywallst.com