
- PRICING
- LIVE QUOTES
- LEARN
- HELP


EN
CoStar Group (CSGP) Stock Looks Undervalued Despite Mixed Valuation Signals
CoStar Group stock has had a difficult run over the past year, yet the current market price sits at a discount to an intrinsic value estimate based on a Discounted Cash Flow (DCF) model, while broader valuation checks point to a more mixed picture.
- Over the past 1 year the share price has declined 61.8%, which means recent investors have faced heavy losses even before considering any valuation upside.
- Recent housing and multifamily data from CoStar platforms such as Homes.com and Apartments.com may support expectations for the business, while uncertainty around broader industrial property demand and costs can still weigh on how investors value future cash flows.
- CoStar Group currently scores 3 of 6 on Simply Wall St's broader valuation checks, which is a mixed picture rather than a clear bargain or clear overvaluation, as shown in this valuation summary.
The issue now is whether the discount implied by the DCF style intrinsic value estimate offers enough compensation for the recent share price decline and the mixed signals from the wider valuation checks.
Find out why CoStar Group's -61.8% return over the last year is lagging behind its peers.
Is CoStar Group a Bargain on Cash Flow?
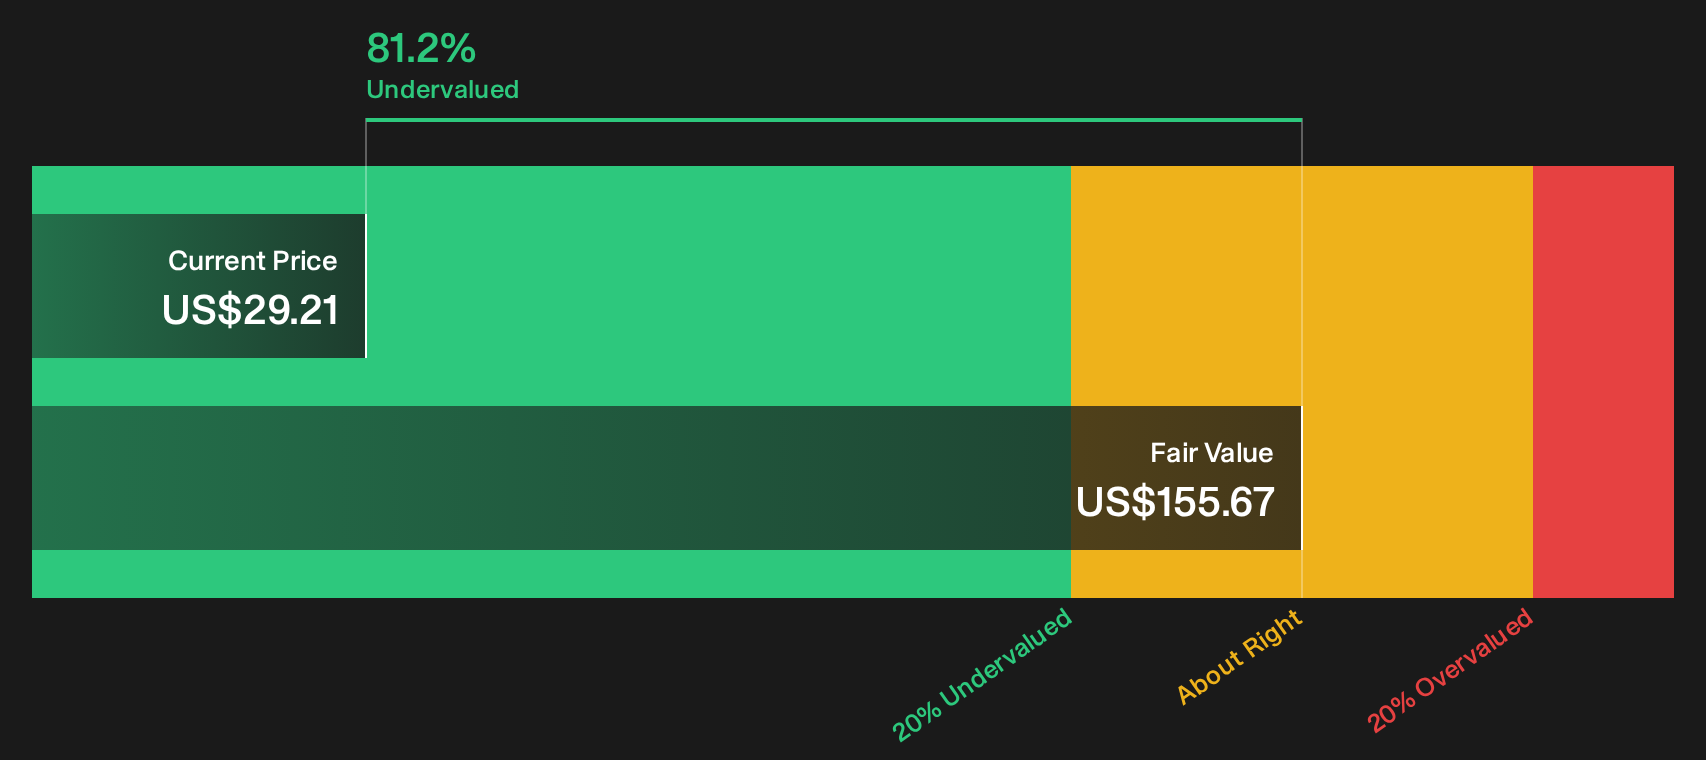
The Discounted Cash Flow (DCF) method estimates what CoStar Group could be worth based on its future cash generation. In this model, the latest twelve month free cash flow is about $15.8 million, which is relatively modest compared with the multiyear projections that assume growing free cash flow over time. On that basis, the 2 Stage Free Cash Flow to Equity model arrives at an estimated intrinsic value of about $63 per share.
That compares with the current market price, which implies a discount of roughly 46.7%. Because Apartments.com and CoStar have recently reported firmer multifamily conditions and a stronger rent growth outlook for 2026, some investors may see a gap between these operating indicators and how cautiously the market is pricing CoStar Group stock today.
On this DCF view, CoStar Group stock appears undervalued relative to its estimated intrinsic value.
Our Discounted Cash Flow (DCF) analysis suggests CoStar Group is undervalued by 46.7%. Track this in your watchlist or portfolio, or discover 51 more high quality undervalued stocks.
Does CoStar Group Look Fairly Valued on Sales?
P/S is often a useful way to look at CoStar Group because the business is heavily focused on recurring information and marketplace revenue rather than current earnings.
CoStar Group trades on a P/S of about 3.8x, compared with a real estate industry average of roughly 2.4x and a peer group average near 1.5x. That points to a premium against both the broader sector and closer peers. The modelled fair P/S ratio for CoStar Group is about 3.9x, which is very close to where the stock is currently trading.
This fair ratio already factors in the company’s size, margins and risk profile, so the small gap between 3.8x and 3.9x does not suggest a major discount or an extreme premium on sales.
On the P/S multiple, CoStar Group stock appears roughly fairly valued at current levels.

See what the numbers say about this price — find out in our valuation breakdown.
The CoStar Group Narrative: What Would Justify Today's Price?
Simply Wall St Narratives pick up where these CoStar Group valuation checks leave off. They spell out which paths for growth, margins and earnings would need to play out for the stock to be worth materially more or less than today’s price on the Community page. Each narrative links its number to a clear view of how CoStar Group's growth, profitability and risks could evolve, giving you something concrete to revisit as fresh information arrives.
One of the top community narratives on CoStar Group: 35% undervalued
"Heavy reallocation of software development toward AI driven features such as Smart Search and answer engine optimization is already associated with improved engagement and lead conversion…"
Read one of the top narratives on CoStar Group
Do you think there's more to the story for CoStar Group? Head over to our Community to see what others are saying!
The Bottom Line
CoStar Group screens as undervalued on the Discounted Cash Flow (DCF) intrinsic value estimate, yet the market multiple view suggests the stock is priced about right on sales. That mixed signal reflects a gap between what long term cash flow assumptions imply and what current sentiment and peer comparisons are willing to pay. The key question is whether CoStar Group can turn its data platforms and marketplaces into the level and timing of free cash flow that the intrinsic value model assumes. For now, the crux of the debate is whether the current discount is compensation for execution and cost risks or a genuine opportunity.
This article by Simply Wall St is general in nature. We provide commentary based on historical data and analyst forecasts only using an unbiased methodology and our articles are not intended to be financial advice. It does not constitute a recommendation to buy or sell any stock, and does not take account of your objectives, or your financial situation. We aim to bring you long-term focused analysis driven by fundamental data. Note that our analysis may not factor in the latest price-sensitive company announcements or qualitative material. Simply Wall St has no position in any stocks mentioned.
Have feedback on this article? Concerned about the content? Get in touch with us directly. Alternatively, email editorial-team@simplywallst.com