
- PRICING
- LIVE QUOTES
- LEARN
- HELP


EN
3 Undervalued European Small Caps With Recent Insider Buying
The European market has recently faced mixed performance, with the pan-European STOXX Europe 600 Index ending slightly lower amid resilient economic data and geopolitical uncertainties. In this environment, small-cap stocks can offer unique opportunities for investors seeking growth potential, particularly when there is evidence of insider buying as a sign of confidence in a company's future prospects.
Top 10 Undervalued Small Caps With Insider Buying In Europe
| Name | PE | PS | Discount to Fair Value | Value Rating |
|---|---|---|---|---|
| Eurocell | 11.9x | 0.3x | 47.57% | ★★★★★☆ |
| Bilia | 15.7x | 0.3x | 32.81% | ★★★★★☆ |
| Nederman Holding | 18.5x | 0.8x | 26.34% | ★★★★★☆ |
| NoHo Partners Oyj | 16.0x | 0.5x | 31.23% | ★★★★☆☆ |
| Franchise Brands | 26.8x | 2.0x | 48.14% | ★★★★☆☆ |
| Linc | 13.0x | 13.5x | 30.38% | ★★★★☆☆ |
| CellaVision | 28.6x | 5.0x | 41.24% | ★★★☆☆☆ |
| Travis Perkins | NA | 0.3x | -76.46% | ★★★☆☆☆ |
| Samhällsbyggnadsbolaget i Norden | NA | 3.1x | -109.67% | ★★★☆☆☆ |
| John Mattson Fastighetsföretagen | 8.1x | 6.3x | 1.24% | ★★★☆☆☆ |
Here we highlight a subset of our preferred stocks from the screener.
Domino's Pizza Group (LSE:DOM)
Simply Wall St Value Rating: ★★★★☆☆
Overview: Domino's Pizza Group operates as a leading pizza delivery and carryout chain in the UK and Ireland, with a market cap of approximately £1.67 billion.
Operations: Domino's Pizza Group generates revenue primarily through its sales, with a gross profit margin reaching up to 47.99% in recent periods. The company faces significant costs of goods sold (COGS), which have increased alongside revenue, impacting the overall gross profit. Operating expenses, including general and administrative expenses and sales and marketing costs, also form a substantial part of the company's cost structure. Net income margins have shown variability over time but reached 18.28% at their peak in recent years.
PE: 12.5x
Domino's Pizza Group, a smaller player in the European market, has demonstrated steady financial performance with half-year sales reaching £353.6 million and net income at £30.6 million. Insider confidence is evident as recent share purchases have been noted, reflecting optimism about the company's trajectory. Despite high debt levels due to reliance on external borrowing, earnings are projected to grow annually by 9.29%. A proposed interim dividend increase further signals potential value for investors seeking growth opportunities in this sector.
- Dive into the specifics of Domino's Pizza Group here with our thorough valuation report.
Evaluate Domino's Pizza Group's historical performance by accessing our past performance report.
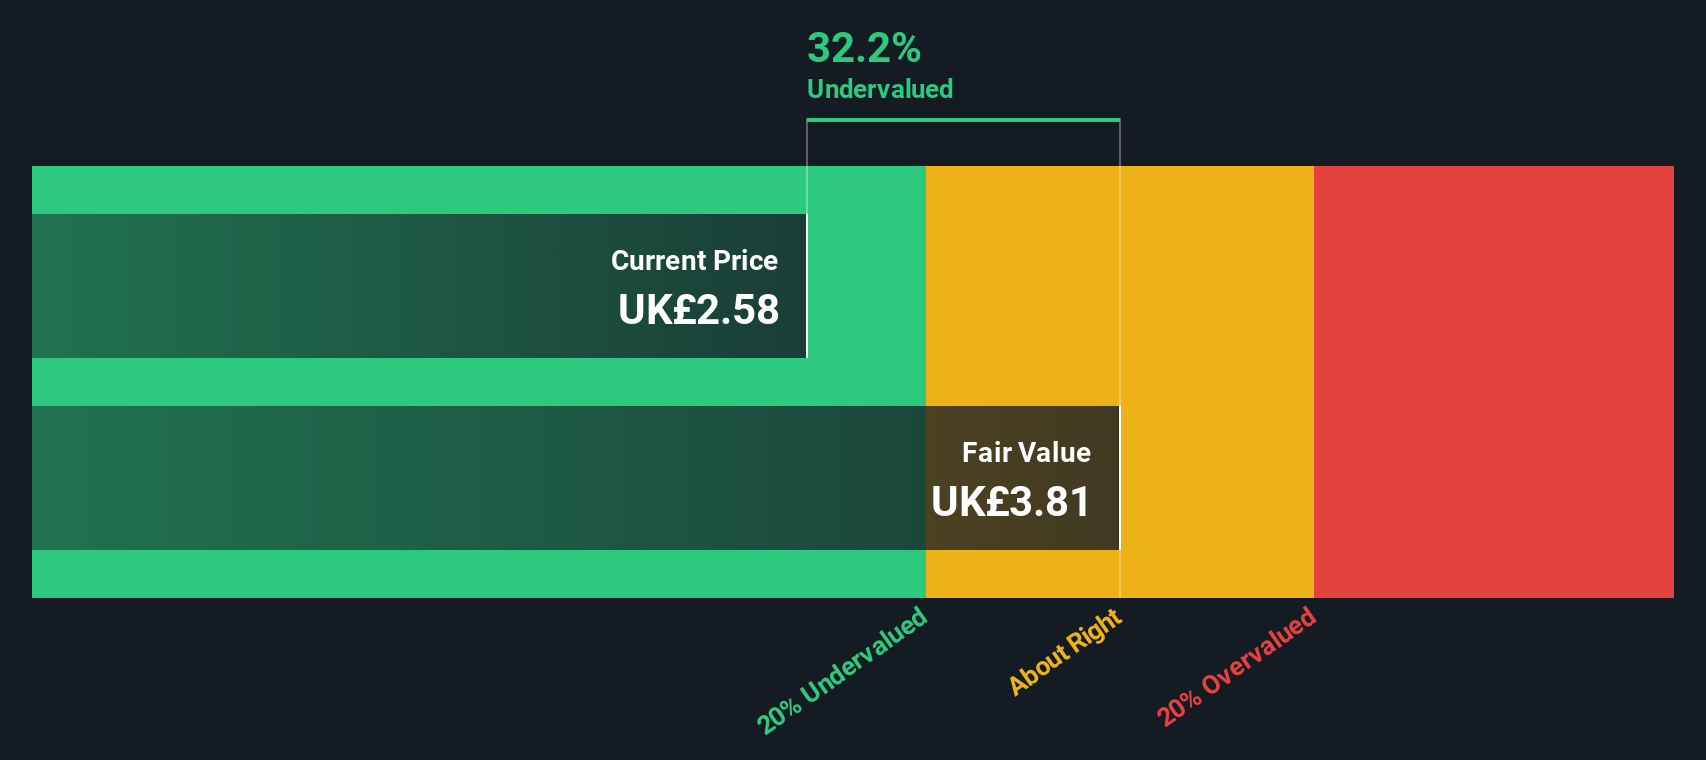
Travis Perkins (LSE:TPK)
Simply Wall St Value Rating: ★★★☆☆☆
Overview: Travis Perkins is a leading UK-based company specializing in the distribution of building materials and home improvement products, with a market cap of £1.49 billion.
Operations: The company generates revenue primarily from Merchanting (£3.67 billion) and Toolstation (£849.4 million). Over recent periods, the gross profit margin has shown significant fluctuations, with a notable decline to -9.54% in mid-2023 before recovering to 26.62% by mid-2026. Operating expenses have remained a substantial portion of costs, with sales and marketing being a significant component of these expenses.
PE: -7.8x
Travis Perkins, a notable player in the European market, has shown resilience with net income rising to £30.3 million for H1 2026 from £26.4 million the previous year despite sales dipping slightly to £2.26 billion. The company faces higher risk due to reliance on external borrowing but is poised for potential growth with earnings projected to increase by 79% annually. Recent insider confidence was demonstrated through share purchases earlier this year, hinting at optimism about future prospects.
- Navigate through the intricacies of Travis Perkins with our comprehensive valuation report here.
Understand Travis Perkins' track record by examining our Past report.
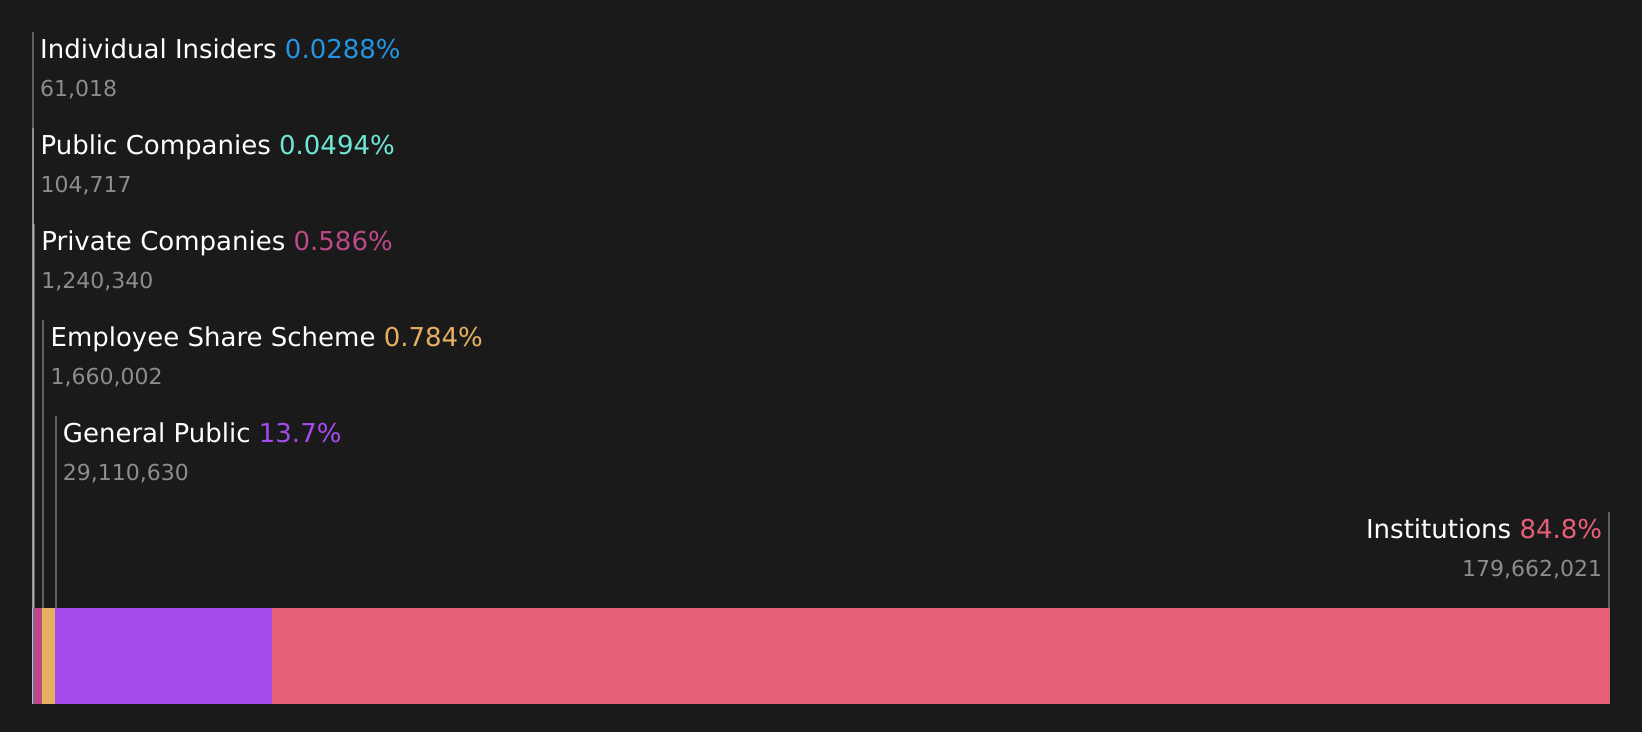
Hemnet Group (OM:HEM)
Simply Wall St Value Rating: ★★★☆☆☆
Overview: Hemnet Group operates as an internet information provider specializing in real estate listings and services, with a market cap of approximately SEK 11.65 billion.
Operations: The company generates revenue primarily from its Internet Information Providers segment, with recent figures showing a gross profit margin of 84.13%. Operating expenses, including general and administrative costs, are significant components of the cost structure. The net income margin has shown fluctuations over time, reaching 29.56% in the latest period.
PE: 23.8x
Hemnet Group, a player in the European property market, is navigating financial challenges with declining sales and earnings. In Q2 2026, revenue fell to SEK 372.3 million from SEK 484 million a year prior. Despite these hurdles, Hemnet's innovative "Under-the-radar" service enhances early-stage property visibility for strategic partners. Recent board resignations and a new CFO appointment signal potential shifts in leadership dynamics. The company's reliance on external borrowing raises risk concerns amidst volatile share prices over the past three months.
- Take a closer look at Hemnet Group's potential here in our valuation report.
Explore historical data to track Hemnet Group's performance over time in our Past section.
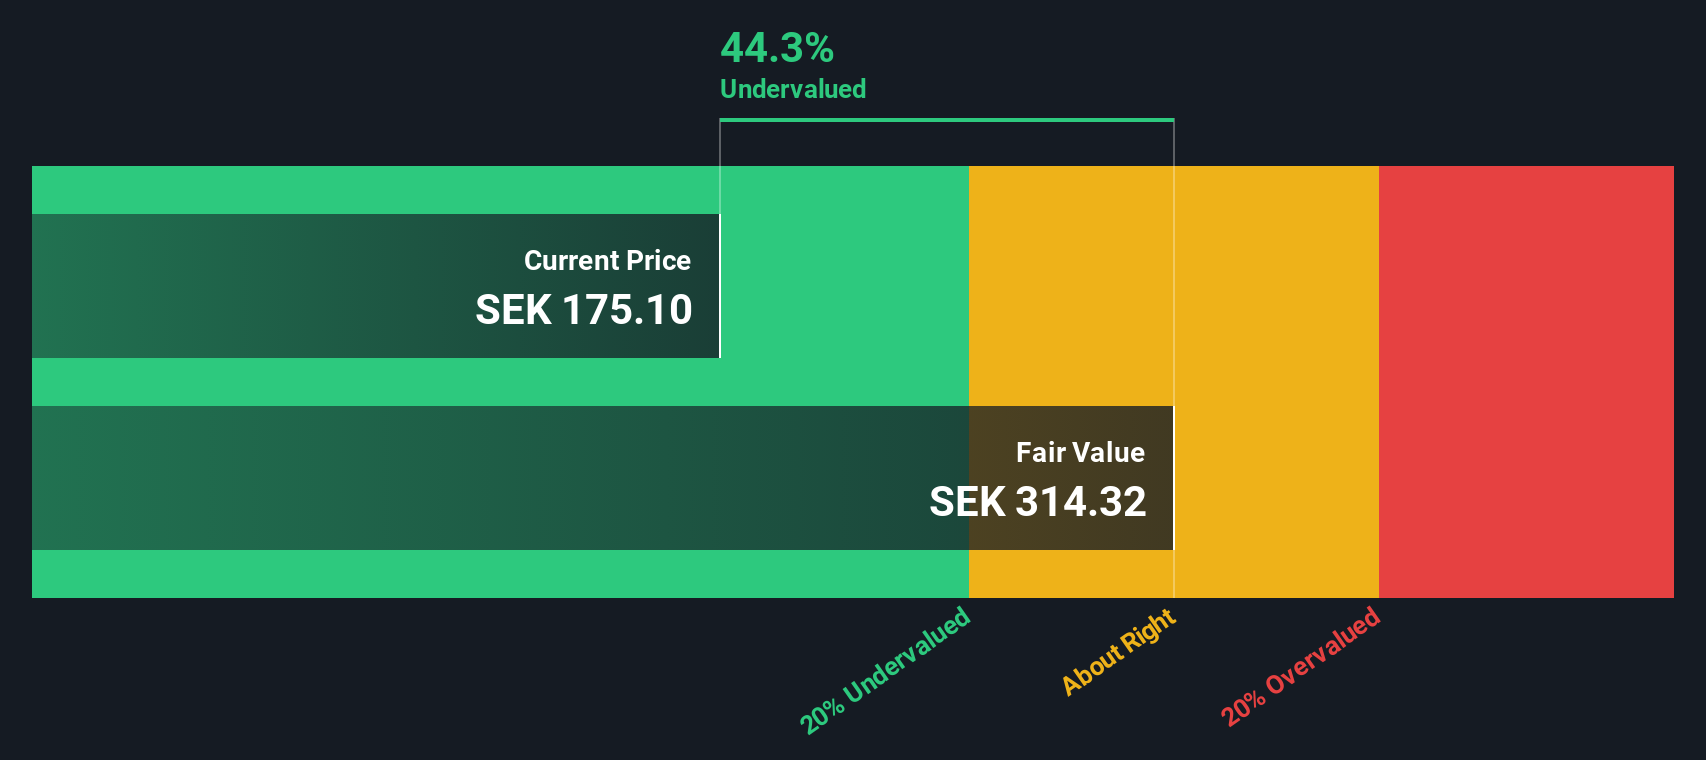
Summing It All Up
- Unlock more gems! Our Undervalued European Small Caps With Insider Buying screener has unearthed 49 more companies for you to explore.Click here to unveil our expertly curated list of 52 Undervalued European Small Caps With Insider Buying.
- Shareholder in one or more of these companies? Ensure you're never caught off-guard by adding your portfolio in Simply Wall St for timely alerts on significant stock developments.
- Enhance your investing ability with the Simply Wall St app and enjoy free access to essential market intelligence spanning every continent.
Interested In Other Possibilities?
- Explore high-performing small cap companies that haven't yet garnered significant analyst attention.
- Fuel your portfolio with companies showing strong growth potential, backed by optimistic outlooks both from analysts and management.
- Find companies with promising cash flow potential yet trading below their fair value.
This article by Simply Wall St is general in nature. We provide commentary based on historical data and analyst forecasts only using an unbiased methodology and our articles are not intended to be financial advice. It does not constitute a recommendation to buy or sell any stock, and does not take account of your objectives, or your financial situation. We aim to bring you long-term focused analysis driven by fundamental data. Note that our analysis may not factor in the latest price-sensitive company announcements or qualitative material. Simply Wall St has no position in any stocks mentioned.
Have feedback on this article? Concerned about the content? Get in touch with us directly. Alternatively, email editorial-team@simplywallst.com