
- PRICING
- LIVE QUOTES
- LEARN
- HELP


EN
Three Hidden Asian Stocks with Promising Potential
As global markets continue to navigate economic uncertainties and shifting monetary policies, the Asian market presents intriguing opportunities, particularly within its small-cap sector. With key indices like the S&P MidCap 400 and Russell 2000 showing resilience amidst mixed economic signals, investors are increasingly on the lookout for stocks that exhibit strong fundamentals, growth potential, and strategic positioning in this dynamic environment.
Top 10 Undiscovered Gems With Strong Fundamentals In Asia
| Name | Debt To Equity | Revenue Growth | Earnings Growth | Health Rating |
|---|---|---|---|---|
| DeHua TB New Decoration MaterialLtd | 0.63% | 1.50% | 2.14% | ★★★★★★ |
| Envipro Holdings | 39.71% | 0.65% | -14.56% | ★★★★★★ |
| Kyosan Electric Manufacturing | 46.17% | 7.20% | 17.51% | ★★★★★★ |
| BBGI | 18.41% | 10.19% | -20.25% | ★★★★★★ |
| CNMC Goldmine Holdings | 2.29% | 35.67% | 73.16% | ★★★★★☆ |
| Forth Smart Service | 44.85% | -3.80% | 10.19% | ★★★★★☆ |
| uSonar | 5.92% | 15.94% | 37.41% | ★★★★★☆ |
| Dmall | 59.68% | 15.24% | 23.16% | ★★★★★☆ |
| Sing Investments & Finance | 0.10% | 5.85% | 7.00% | ★★★★☆☆ |
| Shengda ResourcesLtd | 57.58% | 8.61% | 9.90% | ★★★☆☆☆ |
Let's uncover some gems from our specialized screener.
First Tractor (SEHK:38)
Simply Wall St Value Rating: ★★★★★★
Overview: First Tractor Company Limited focuses on producing, manufacturing, and selling agricultural and power machinery, with a market cap of HK$14.38 billion.
Operations: First Tractor generates revenue primarily from its agricultural and power machinery segments. The company reported a market capitalization of HK$14.38 billion.
First Tractor, a smaller player in the machinery sector, is trading at 46.4% below its estimated fair value, suggesting potential for value investors. Despite a recent negative earnings growth of -0.8%, which contrasts with the industry's 7.5% average, the company boasts high-quality past earnings and forecasts an annual earnings growth of 19.52%. Its financial health appears robust with a debt-to-equity ratio reduced from 9.8 to 5.6 over five years and more cash than total debt on hand, indicating sound management practices and strong interest coverage capabilities that may appeal to cautious investors seeking stability amidst volatility.
- Click to explore a detailed breakdown of our findings in First Tractor's health report.
Review our historical performance report to gain insights into First Tractor's's past performance.
Shannon Semiconductor TechnologyLtd (SZSE:300475)
Simply Wall St Value Rating: ★★★★★☆
Overview: Shannon Semiconductor Technology Co., Ltd. operates in the semiconductor industry and has a market capitalization of approximately CN¥81.50 billion.
Operations: Shannon Semiconductor Technology Co., Ltd. generates revenue primarily through its semiconductor operations, with a market capitalization of approximately CN¥81.50 billion.
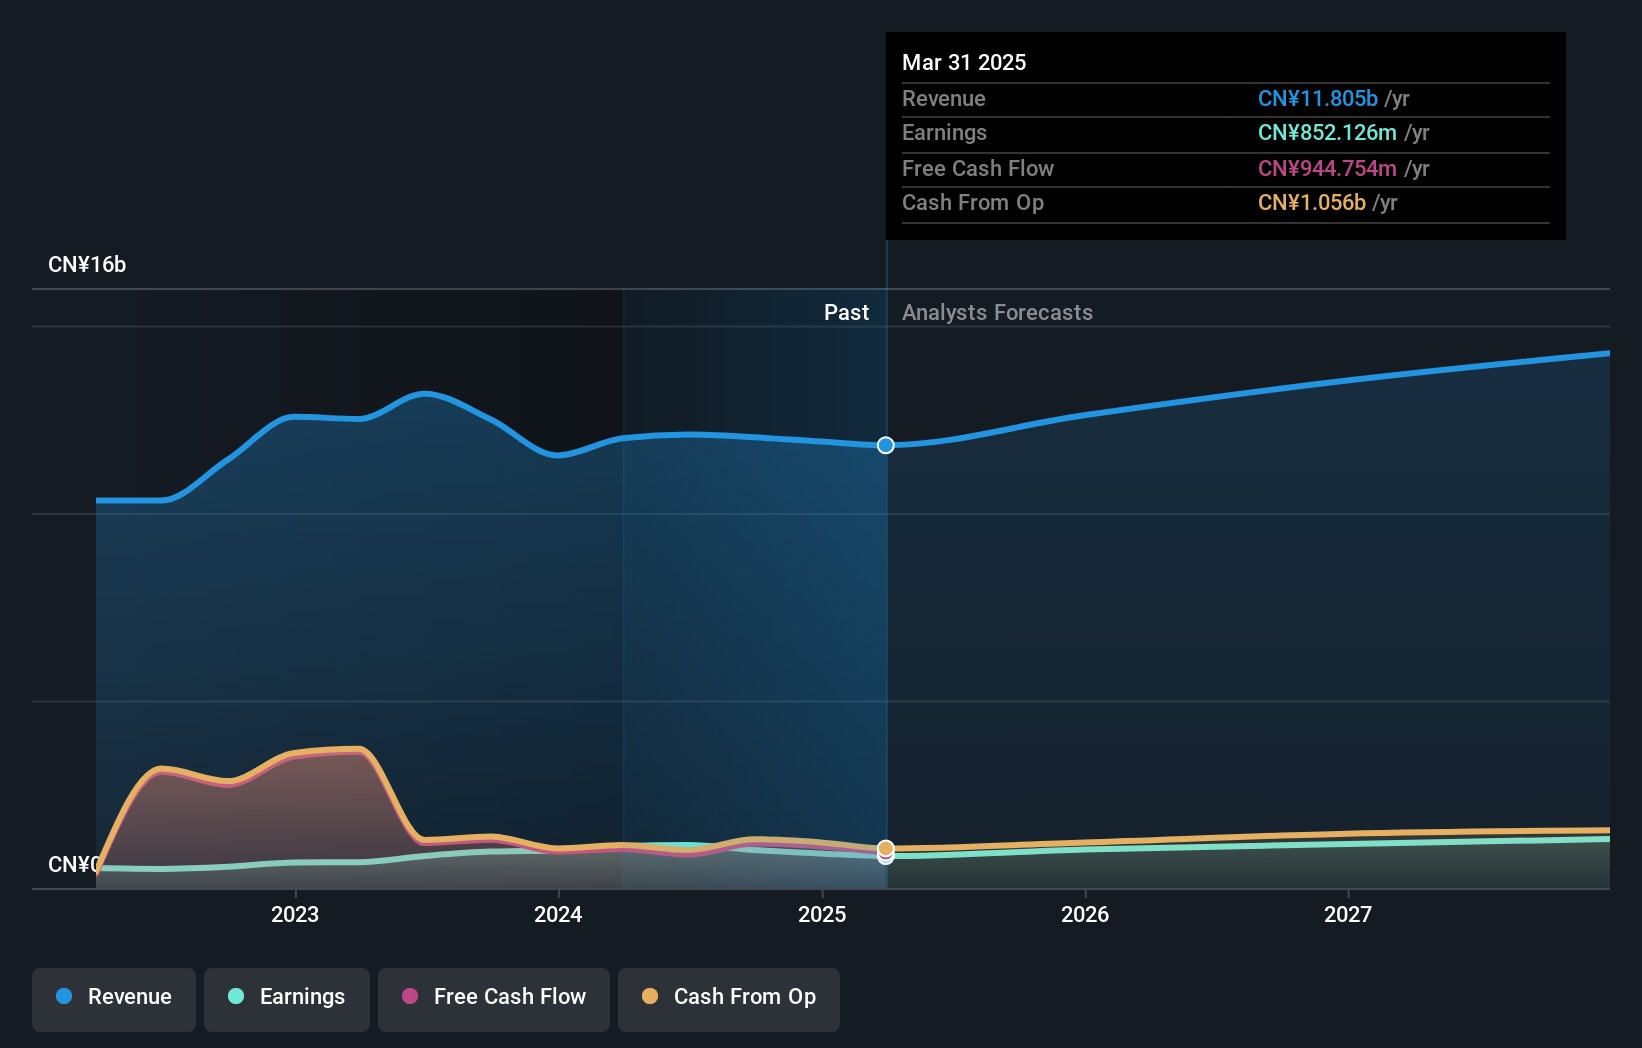
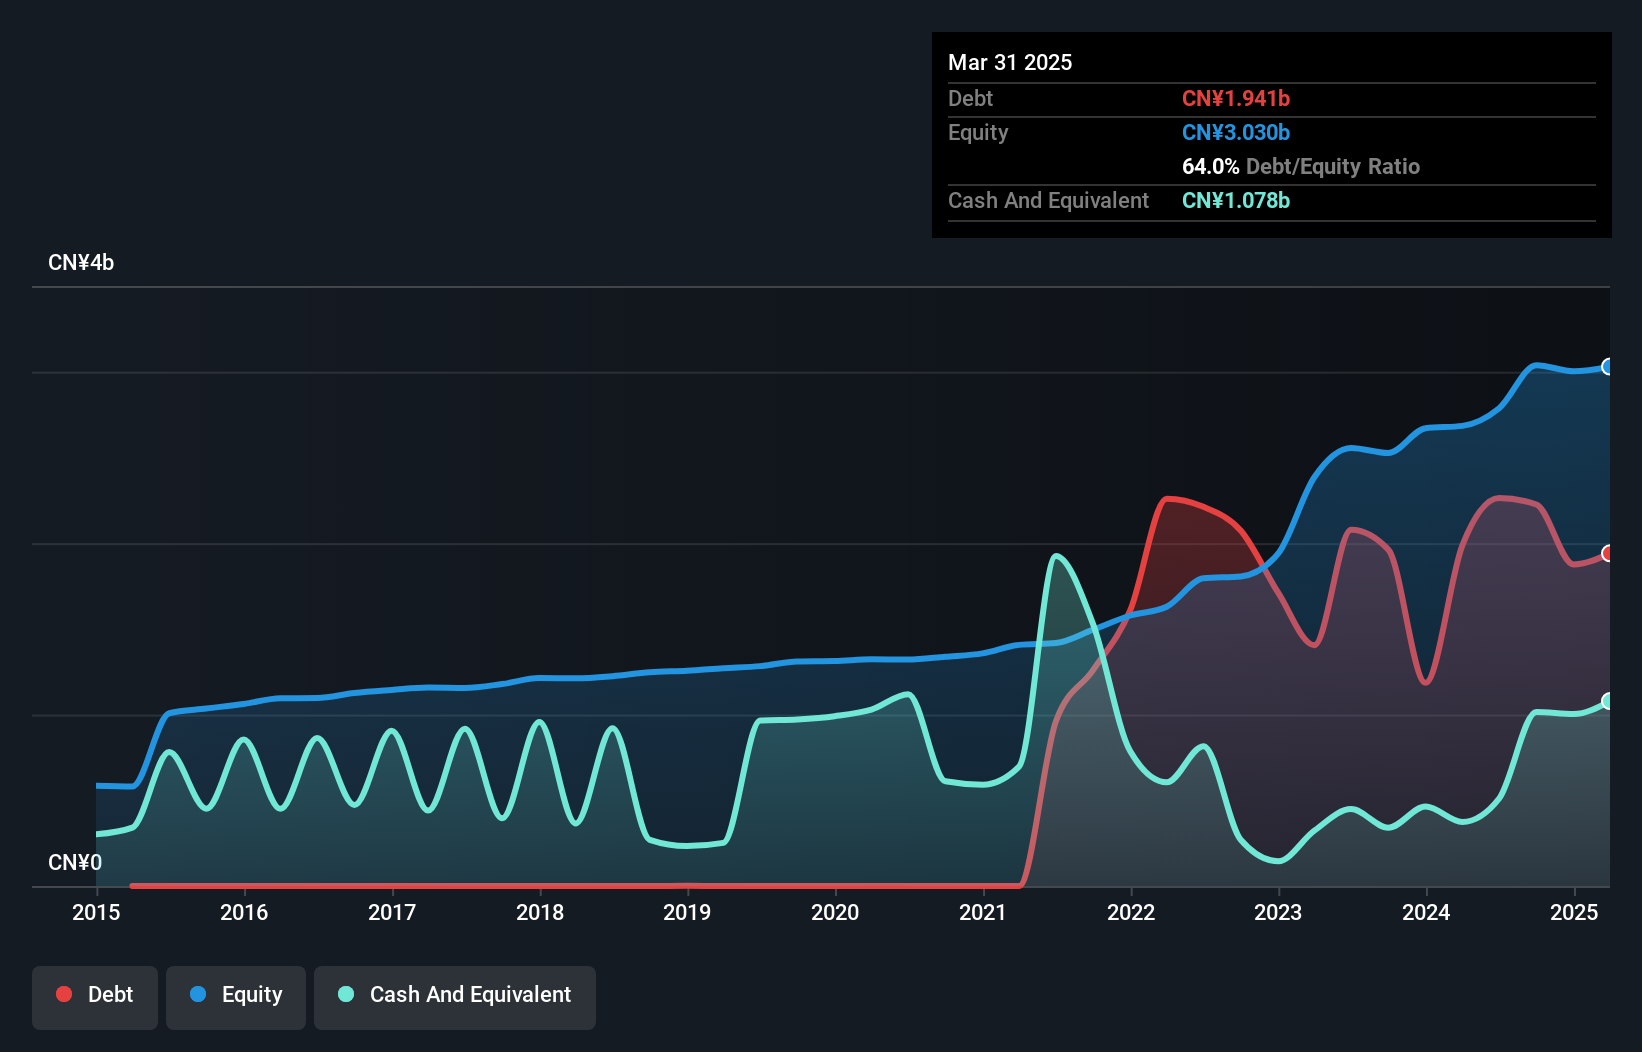
Shannon Semiconductor Technology Ltd. is making waves with a stellar earnings growth of 595.6% over the past year, outpacing the Electronic industry’s 10.1%. This performance comes despite a rise in its debt-to-equity ratio from 0% to 73.8% over five years, yet it stands on solid ground with cash exceeding total debt and an EBIT covering interest payments by 8.1 times. Trading at a significant discount of 83% below estimated fair value, Shannon's shares have been volatile recently but remain attractive due to its high-quality earnings and positive free cash flow standing at CNY 366 million as of June 2024.
Nan Pao Resins Chemical (TWSE:4766)
Simply Wall St Value Rating: ★★★★★☆
Overview: Nan Pao Resins Chemical Co., Ltd. is involved in the manufacturing, wholesale, and retail sale of synthetic resins and plastics, adhesives, resin coatings, dyes, and pigments across various regions including Taiwan and globally; it has a market cap of NT$39.79 billion.
Operations: The company generates revenue through the sale of synthetic resins, plastics, adhesives, resin coatings, dyes, and pigments across multiple regions. Its financial performance includes a gross profit margin of 25%, reflecting its ability to manage production costs effectively.
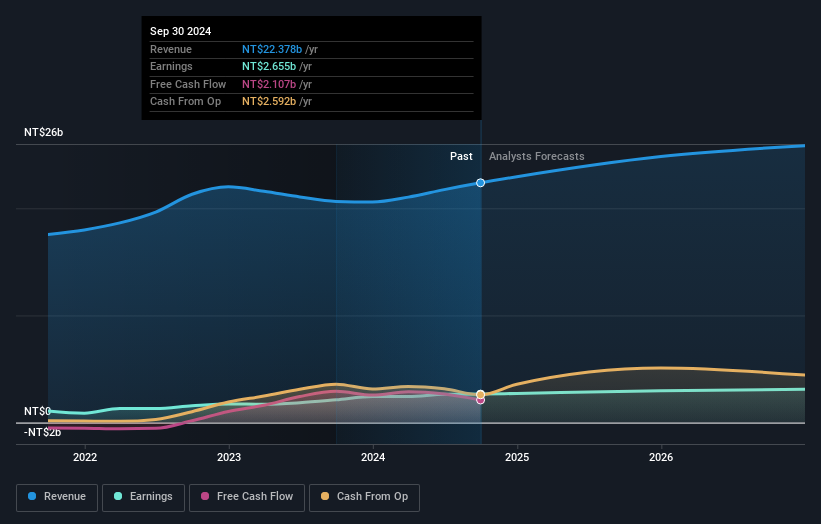
Nan Pao Resins Chemical, a promising player in the Asian market, has demonstrated robust financial performance. Its recent earnings report shows sales of TWD 6.58 billion for Q2 2026, up from TWD 5.81 billion the previous year, with net income rising to TWD 876.58 million from TWD 553.54 million. Basic earnings per share increased to TWD 7.27 from TWD 4.59, indicating strong profitability growth over time at an annual rate of about 17%. Despite a rise in its debt-to-equity ratio from 23% to roughly 37% over five years, it remains financially stable with more cash than total debt and positive free cash flow trends observed recently at approximately US$2 billion as of June this year.
- Unlock comprehensive insights into our analysis of Nan Pao Resins Chemical stock in this health report.
Understand Nan Pao Resins Chemical's track record by examining our Past report.
Where To Now?
- Unlock more gems! Our Asian Undiscovered Gems With Strong Fundamentals screener has unearthed 115 more companies for you to explore.Click here to unveil our expertly curated list of 118 Asian Undiscovered Gems With Strong Fundamentals.
- Have you diversified into these companies? Leverage the power of Simply Wall St's portfolio to keep a close eye on market movements affecting your investments.
- Maximize your investment potential with Simply Wall St, the comprehensive app that offers global market insights for free.
Want To Explore Some Alternatives?
- Explore high-performing small cap companies that haven't yet garnered significant analyst attention.
- Fuel your portfolio with companies showing strong growth potential, backed by optimistic outlooks both from analysts and management.
- Find companies with promising cash flow potential yet trading below their fair value.
This article by Simply Wall St is general in nature. We provide commentary based on historical data and analyst forecasts only using an unbiased methodology and our articles are not intended to be financial advice. It does not constitute a recommendation to buy or sell any stock, and does not take account of your objectives, or your financial situation. We aim to bring you long-term focused analysis driven by fundamental data. Note that our analysis may not factor in the latest price-sensitive company announcements or qualitative material. Simply Wall St has no position in any stocks mentioned.
Have feedback on this article? Concerned about the content? Get in touch with us directly. Alternatively, email editorial-team@simplywallst.com