
- PRICING
- LIVE QUOTES
- LEARN
- HELP


EN
Is Lumine Group (TSXV:LMN) Fully Valued As Revenue Rises But Profit Falls?
Lumine Group (TSXV:LMN) reported second quarter 2026 results that combined higher revenue with lower profitability. The company also released first half figures that showed a similar pattern in sales and earnings.
See our latest analysis for Lumine Group.
Lumine Group’s CA$24.40 share price has seen mixed momentum, with a 23.86% 90 day share price return against a decline of 9.63% year to date, while the 1 year total shareholder return fell 48.54% and the 3 year total shareholder return gained 16.80%.
If this mix of recent gains and longer term swings has you reassessing your watchlist, it could be a good moment to broaden your search and check out 3 top founder-led companies
Lumine Group’s recent rebound comes alongside higher sales but lower earnings, which leaves a key tension. Are investors now paying for improving fundamentals, or has sentiment simply reset after a sharp pullback? And what does that mean for value today?
Price to Earnings of 40.8x: Is it justified?
Lumine Group is trading on a P/E of 40.8x, with the last close at CA$24.40. Compared with different valuation reference points, this multiple sends a mixed message.
The P/E ratio compares the current share price to earnings per share. For a software company like Lumine Group, it reflects what investors are willing to pay today for each dollar of current earnings, given the company’s growth profile and profitability.
On one hand, Lumine Group is described as good value on a P/E basis compared with its peer group average of 59.6x. That suggests the market is placing a lower price tag on its earnings than on similar software companies. On the other hand, the same 40.8x multiple is described as expensive compared with an estimated fair P/E of 29x and also higher than the broader North American software industry average of 33.3x. If market expectations move closer to that fair ratio, the valuation level could shift meaningfully.
Explore the SWS fair ratio for Lumine Group.
Result: Price-to-Earnings of 40.8x (ABOUT RIGHT)
However, Lumine Group still carries risks if profitability keeps lagging revenue or if sentiment cools after the sharp one-year total return decline.
Find out about the key risks to this Lumine Group narrative.
Another View on Lumine Group’s Value
The P/E discussion gives one picture of Lumine Group, but the SWS DCF model points in a different direction. At CA$24.40, the stock is described as trading below an estimated future cash flow value of CA$49.71, which implies undervaluation. How much weight should you place on cash flows versus earnings multiples?
Look into how the SWS DCF model arrives at its fair value.
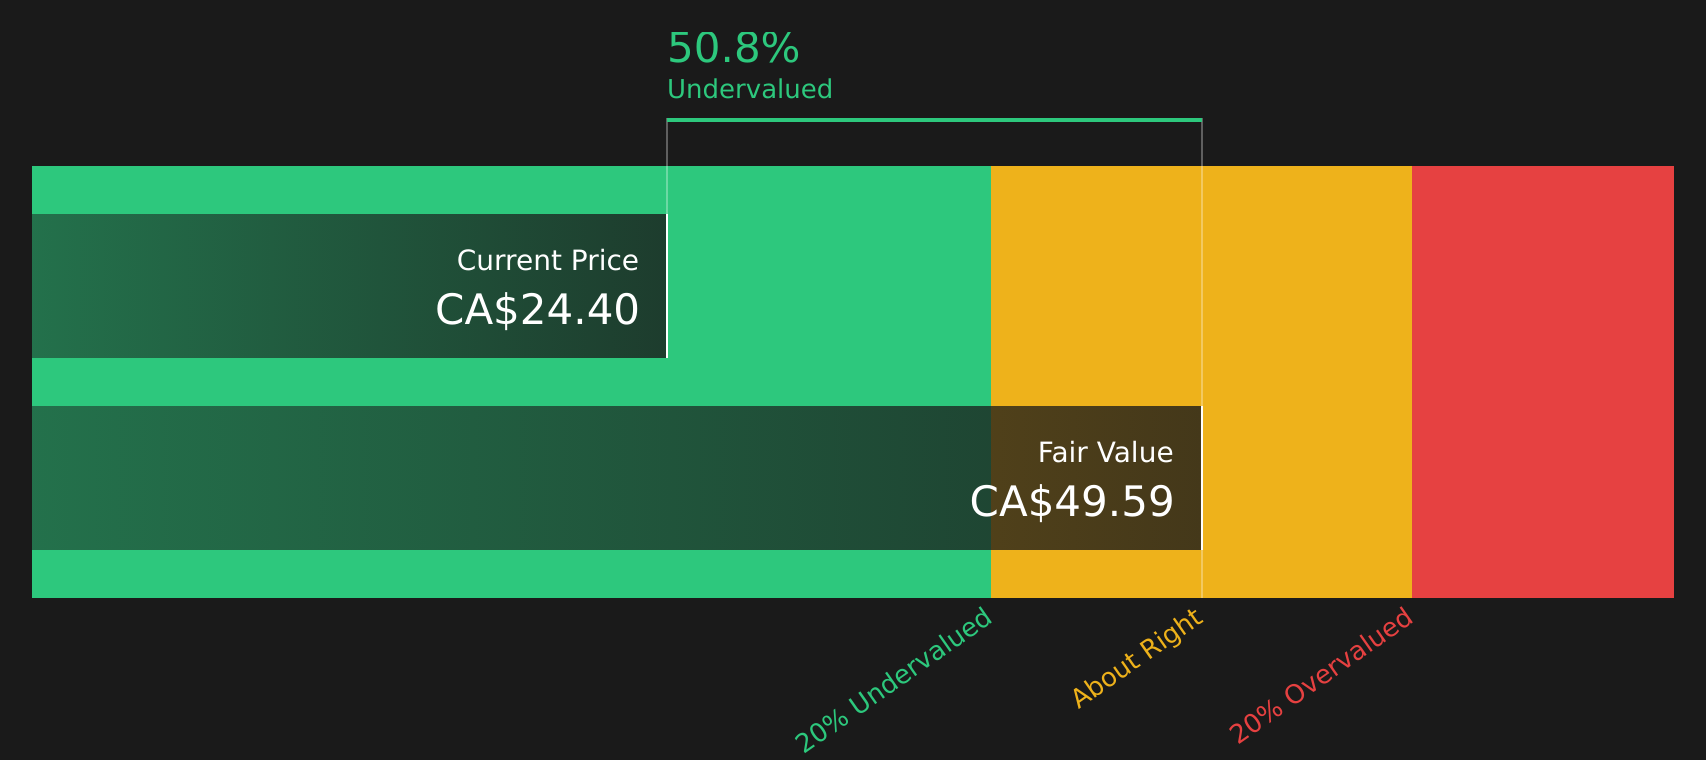
Simply Wall St performs a discounted cash flow (DCF) on every stock in the world every day (check out Lumine Group for example). We show the entire calculation in full. You can track the result in your watchlist or portfolio and be alerted when this changes, or use our stock screener to discover 11 high quality undervalued stocks. If you save a screener we even alert you when new companies match - so you never miss a potential opportunity.
Next Steps
Does Lumine Group’s mix of valuation signals and sentiment leave you curious rather than certain? Take a closer look at the positives investors are watching through 3 key rewards.
Looking for more investment ideas beyond Lumine Group?
If Lumine Group has you rethinking your approach, do not stop here. Broaden your watchlist now so you are not relying on a single story.
- Target potential mispricings by scanning for companies that combine solid fundamentals with value traits using the 11 high quality undervalued stocks.
- Strengthen your core holdings by focusing on resilient companies with healthier financial positions through the solid balance sheet and fundamentals stocks screener (12 results).
- Get ahead of the crowd by zeroing in on lesser known opportunities with strong metrics via the screener containing 8 high quality undiscovered gems.
This article by Simply Wall St is general in nature. We provide commentary based on historical data and analyst forecasts only using an unbiased methodology and our articles are not intended to be financial advice. It does not constitute a recommendation to buy or sell any stock, and does not take account of your objectives, or your financial situation. We aim to bring you long-term focused analysis driven by fundamental data. Note that our analysis may not factor in the latest price-sensitive company announcements or qualitative material. Simply Wall St has no position in any stocks mentioned.
Have feedback on this article? Concerned about the content? Get in touch with us directly. Alternatively, email editorial-team@simplywallst.com