
- PRICING
- LIVE QUOTES
- LEARN
- HELP


EN
Elastic (ESTC) Stock Could Be 41% Undervalued With Cash Flow In Focus
Elastic stock has rallied over the past few years, but long term holders are still facing a decline over five years. Current checks also show an unusual split between its intrinsic value estimate from a Discounted Cash Flow (DCF) model and what the market multiples suggest. The DCF points to Elastic trading at a discount to an estimated intrinsic value, yet the market based multiples appear expensive, leaving investors weighing which signal to trust.
- Over the last five years, Elastic shares have declined about 47%, which keeps long term returns under pressure despite more recent gains.
- Elastic’s valuation can benefit if the company turns revenue growth more effectively into durable free cash flow. However, any setback in cash generation or a need for heavier investment may limit how much of the implied discount is realised.
- On Simply Wall St’s broader checks, Elastic scores 4 out of 6 on valuation, which signals a mixed picture rather than a clear bargain or clear overvaluation.
The issue now is whether Elastic’s current share price around US$83.44 already reflects its long term cash flow potential, or whether the DCF implied upside leaves a reasonable margin of safety.
Is Elastic Still Cheap on Cash Flow?
The Discounted Cash Flow model estimates what Elastic might be worth based on its future cash generation rather than current earnings or revenue multiples. For Elastic, the model starts with the latest twelve month free cash flow of about $321.9 million, then assumes that cash flows continue growing from this base over time.
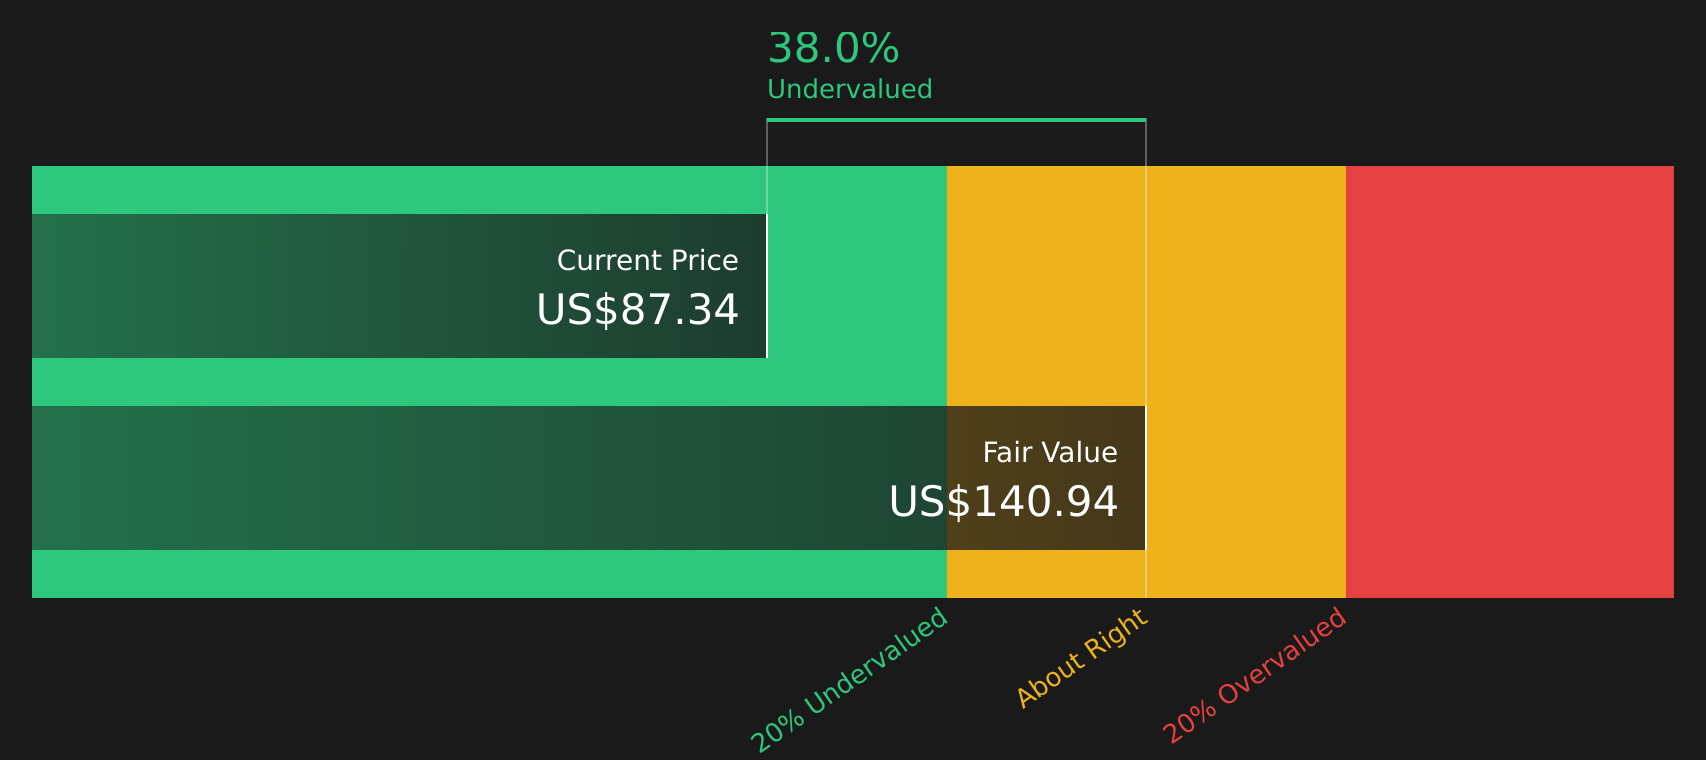
On these cash flow projections, the model arrives at an estimated intrinsic value of about $140.54 per share. That compares to the recent share price around $83.44, which implies a 40.6% discount based on this approach. The output suggests the market is pricing Elastic below the value implied by its projected cash flows, even though other valuation checks such as earnings and sales multiples look less generous.
On this cash flow view, Elastic stock currently screens as undervalued relative to the estimated intrinsic value.
Our Discounted Cash Flow (DCF) analysis suggests Elastic is undervalued by 40.6%. Track this in your watchlist or portfolio, or discover 53 more high quality undervalued stocks.
Has Elastic Run Too Far on Earnings?
The P/E ratio is a useful way to check how much you are paying for each dollar of Elastic earnings. Elastic currently trades on a P/E of about 23.6x, which sits below the broader Software industry average of roughly 30.7x and also below the peer group average near 46.0x. On a simple comparison with those benchmarks, the stock does not look especially stretched.
However, Simply Wall St’s fair P/E estimate for Elastic is closer to 15.0x, which reflects its specific mix of growth profile, profitability and risk. Against that tailored yardstick, the current 23.6x implies investors are paying a premium to what the model suggests would be a more neutral earnings multiple.
On this P/E basis, Elastic stock screens as overvalued relative to the modelled fair multiple, even though it trades below some industry and peer benchmarks.

See what the numbers say about this price — find out in our valuation breakdown.
The Elastic Narrative: What Would Justify Today's Price?
Elastic’s valuation puzzle raises a clear question. What would need to happen to Elastic’s growth, margins and earnings for today’s share price to make sense, or for the stock to be worth materially more or less in future? Simply Wall St Narratives on the Community page set out those kinds of paths in plain language, and each connects its number to a specific view on how Elastic’s growth, profitability and risks might evolve as new information comes through.
One of the top community narratives on Elastic: 57% overvalued
"Several bearish analysts frame current valuation as already reflecting meaningful AI potential. Without clearer evidence of durable revenue expansion and improved net retention, they see limited room for multiple expansion."
Read one of the top narratives on Elastic
Do you think there's more to the story for Elastic? Head over to our Community to see what others are saying!
The Bottom Line
Elastic presents a split picture. The Discounted Cash Flow (DCF) intrinsic value estimate points to a large discount, while the earnings multiple view flags the stock as overvalued relative to its tailored fair P/E. The gap comes from different focus areas, with the intrinsic value view hinging on future cash generation and funding needs, and the multiple view hinging on how much growth and margin improvement investors are already pricing in. The key question from here is whether Elastic can convert its revenue into durable free cash flow strongly enough to justify both the current P/E premium and the implied upside in the intrinsic value model.
This article by Simply Wall St is general in nature. We provide commentary based on historical data and analyst forecasts only using an unbiased methodology and our articles are not intended to be financial advice. It does not constitute a recommendation to buy or sell any stock, and does not take account of your objectives, or your financial situation. We aim to bring you long-term focused analysis driven by fundamental data. Note that our analysis may not factor in the latest price-sensitive company announcements or qualitative material. Simply Wall St has no position in any stocks mentioned.
Have feedback on this article? Concerned about the content? Get in touch with us directly. Alternatively, email editorial-team@simplywallst.com