
- PRICING
- LIVE QUOTES
- LEARN
- HELP


EN
China Index Research Institute: Overall second-hand housing transactions in key cities continued to grow year-on-year in July, and transactions in core cities are expected to remain active
The Zhitong Finance App learned that the China Index Research Institute published an article stating that overall second-hand housing transactions in key cities continued to increase year-on-year in July, and the market remained active. The overall month-on-month decline in second-hand housing prices in the top ten cities increased slightly compared to the previous month, and second-hand housing listing prices in Shanghai rose for five consecutive months. Overall, the July policy level continued the “stabilizing market” trend, and all regions continued to promote urban renewal, stock revitalization, and provident fund optimization policies. Looking at the trend, the second-hand housing market is expected to run smoothly, continue the trend of bottoming out and repair, and transactions in core cities remain active. The decline in listing volume has stabilized sellers' expectations. The downward pressure on prices is expected to gradually ease. It is expected to maintain narrow fluctuations, but the differentiation between cities will continue.
The month-on-month decline in second-hand housing prices in the top ten cities increased in July, but the decline was less than that of Baicheng as a whole. Housing prices in Shanghai rose for five consecutive months
Figure: Average price of second-hand housing listings in the top ten cities in July 2026 and the month-on-month ratio
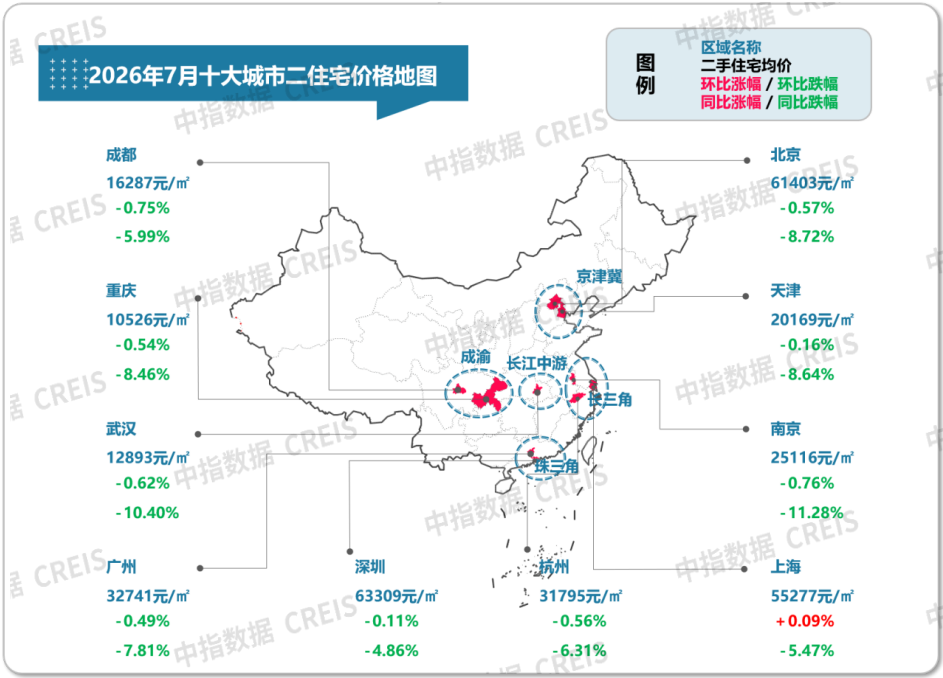
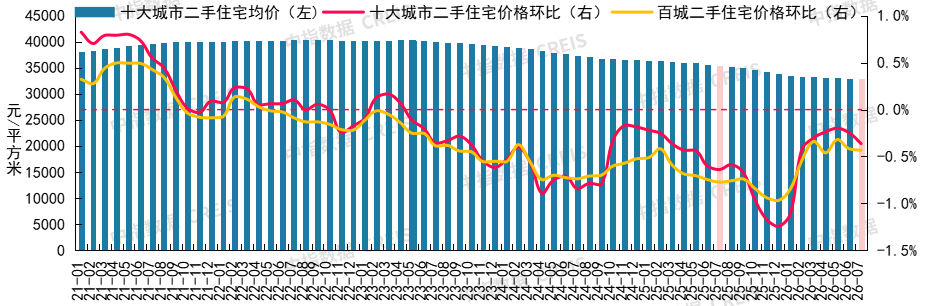
Figure: Average prices and month-on-month changes of second-hand housing in the top ten cities from January 2021 to July 2026
Data source: Middle Index Data CREIS
According to the Baicheng Price Index of the China Real Estate Index system, in July 2026, the average price of second-hand housing in Baicheng fell 0.44% month-on-month and 7.37% year-on-year; the average price of second-hand housing in the top ten cities fell 0.36% month-on-month, down 7.26% year on year.
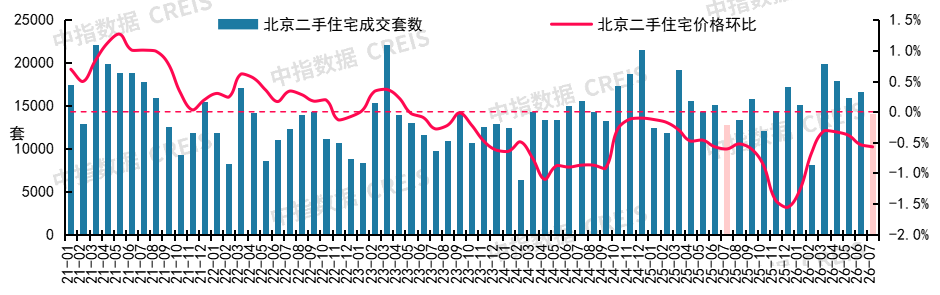
Beijing: The number of second-hand residential units sold in July increased by about 10% year on year, and the month-on-month price decline widened slightly
Figure: Month-on-month trend in the number and price of second-hand residential units sold in Beijing from January 2021 to July 2026
Data source: Middle Index Data CREIS
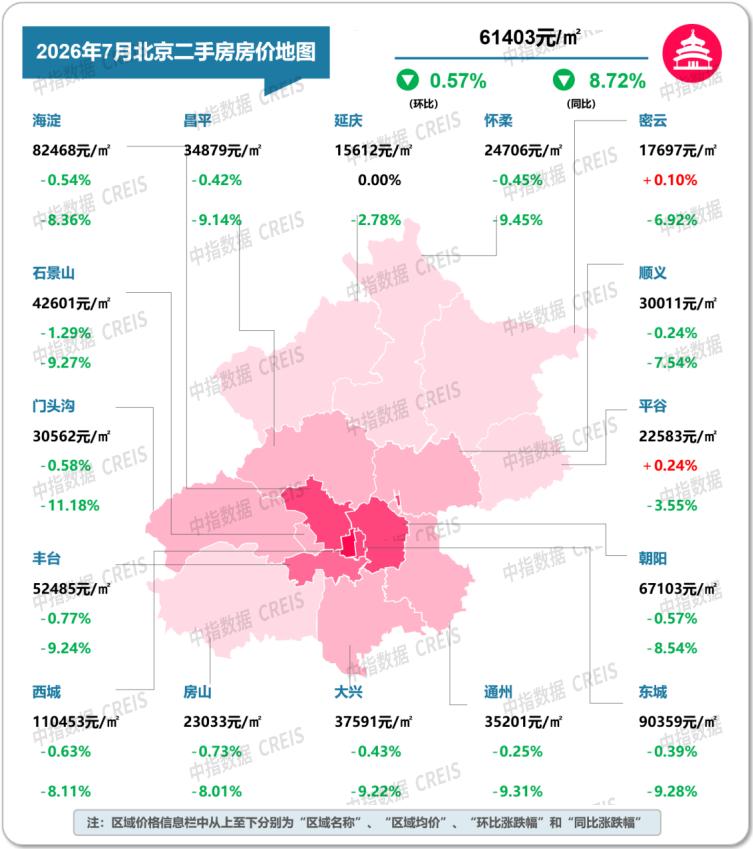
In terms of transactions, in July 2026, 14037 second-hand residential units were sold in Beijing, an increase of 9.8% over the previous year. In January-July, a total of 108,000 second-hand housing units were sold, an increase of 6.2% over the previous year. In terms of prices, second-hand housing prices in Beijing fell 0.57% in July. The month-on-month decline was 0.03 percentage points higher than the previous month, and the year-on-year decline was 8.72%. The year-on-year decline was 0.03 percentage points narrower than the previous month.
Figure: Average price of second-hand residential listings in Beijing in July 2026 and the month-on-month ratio
Data source: Middle Index Data CREIS
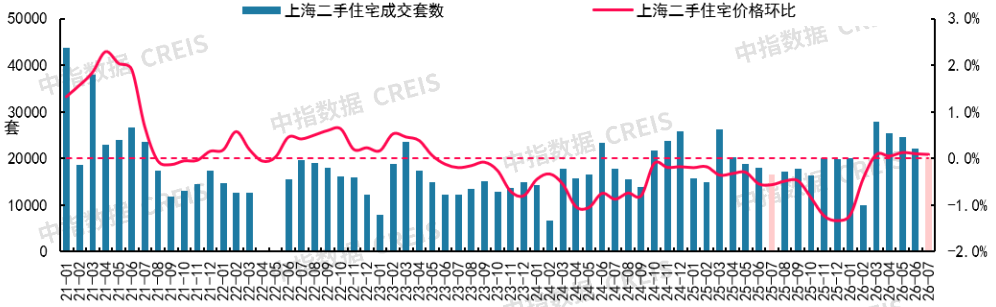
Shanghai: Second-hand housing sold 20,000 units, and prices rose sequentially for five consecutive months
Figure: Month-on-month trend in the number and price of second-hand residential units sold in Shanghai from January 2021 to July 2026
Data source: Middle Index Data CREIS
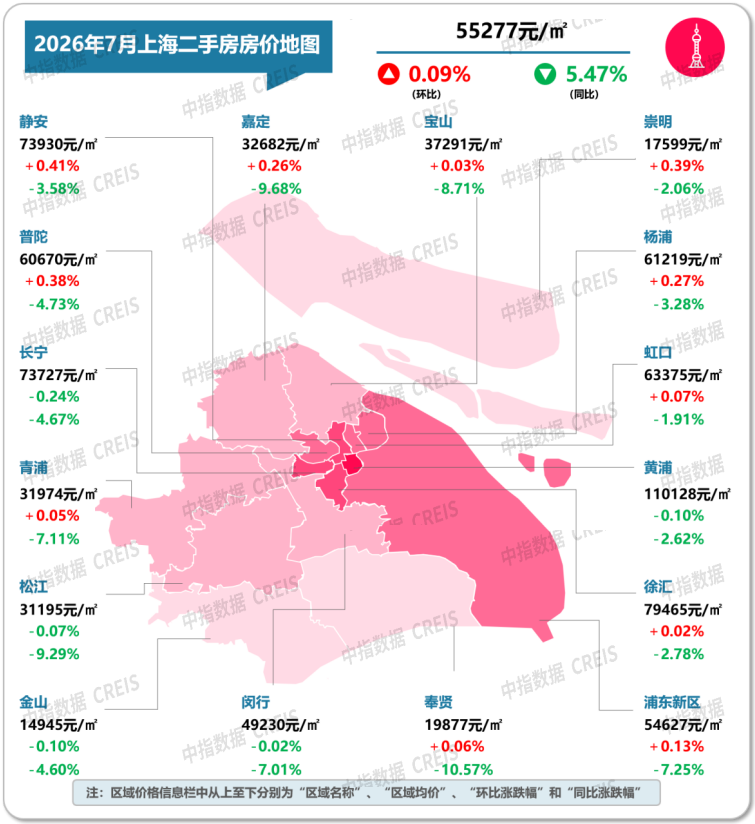
In terms of transactions, in July 2026, 2,0250 second-hand residential units were sold in Shanghai, an increase of 22.0% over the previous year. In January-July, a total of 150,000 second-hand housing units were sold, an increase of 14.9% over the previous year. In terms of prices, in July, the average price of second-hand housing listings in Shanghai rose 0.09% month-on-month. The month-on-month increase has been rising for five consecutive months, falling 5.47% year-on-year, and the year-on-year decline is 0.62 percentage points narrower than the previous month.
Figure: Average price of second-hand residential listings in Shanghai in July 2026 and the month-on-month ratio
Data source: Middle Index Data CREIS
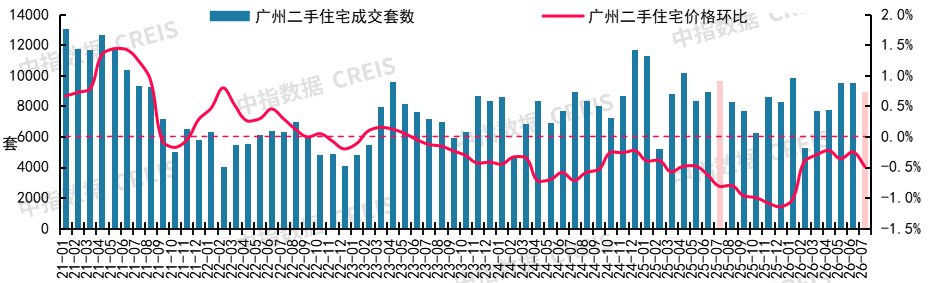
Guangzhou: Second-hand housing transactions fell 7.4% year on year, and the month-on-month price decline widened
Figure: The month-on-month trend of second-hand housing prices in Guangzhou from January 2021 to July 2026
Data source: Middle Index Data CREIS
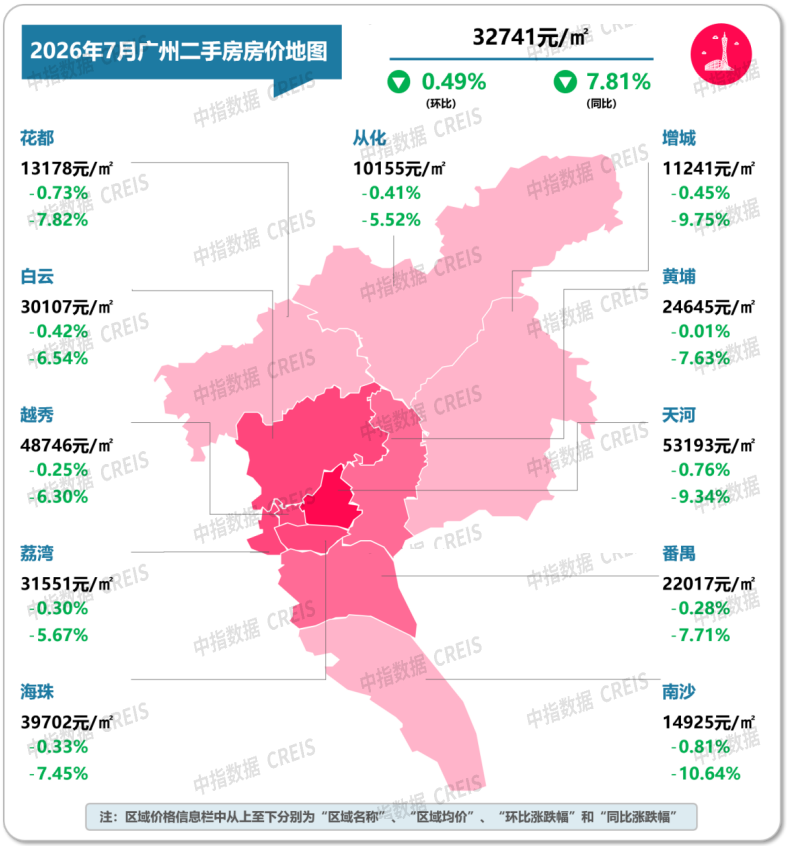
In terms of transactions, in July 2026, 8,968 second-hand residential units were sold in Guangzhou, a year-on-year decrease of 7.4%. In January-July, a total of 59,000 second-hand housing units were sold, a year-on-year decrease of 6.1%. In terms of prices, second-hand housing prices in Guangzhou fell 0.49% month-on-month in July. The month-on-month decline was 0.24 percentage points higher than the previous month, down 7.81% year-on-year, and the year-on-year decline was 0.30 percentage points narrower than the previous month.
Figure: Average price of second-hand residential listings in Guangzhou in July 2026 and the month-on-month ratio
Data source: Middle Index Data CREIS
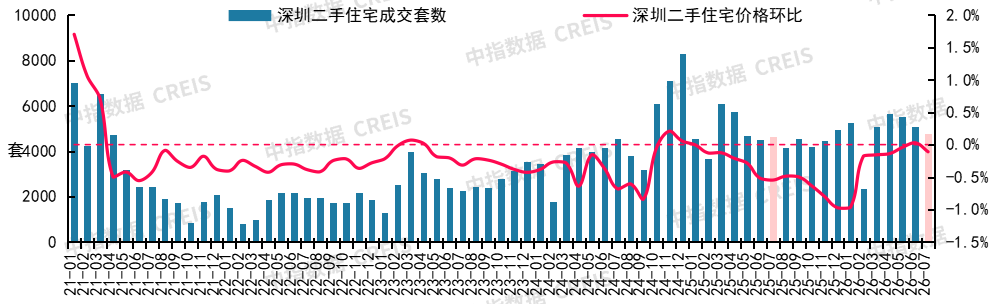
Shenzhen: The second-hand housing market continues to be popular. Sales volume hit a record high in the same period of nearly six years for 3 consecutive months, but prices fell month-on-month
Figure: Month-on-month trend in the number and price of second-hand residential units sold in Shenzhen from January 2021 to July 2026
Data source: Middle Index Data CREIS
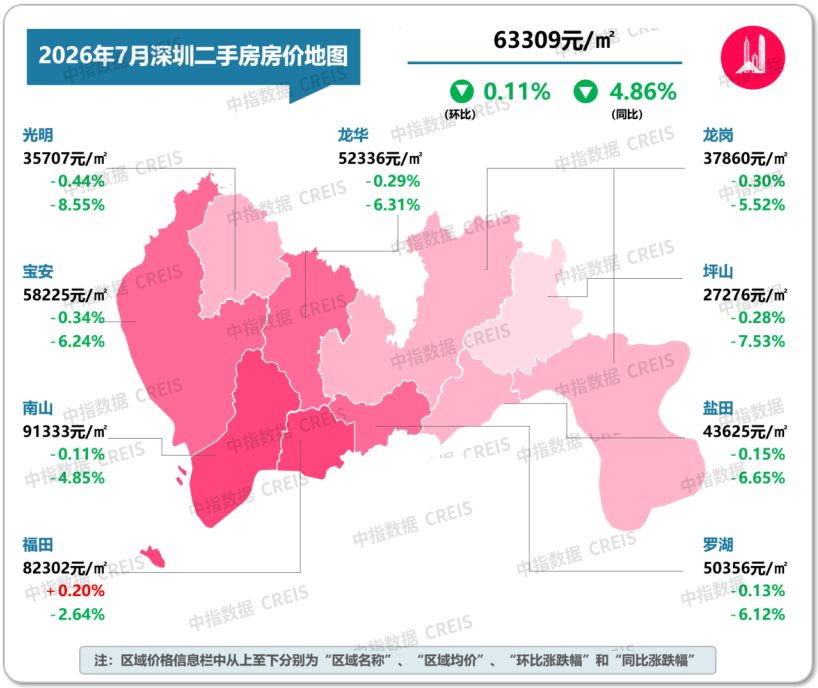
In terms of transactions, in July 2026, 4795 second-hand residential units were sold in Shenzhen, an increase of 3.0% over the previous year. In January-July, a total of 34,000 second-hand housing units were sold, a year-on-year decrease of 0.4%. In terms of prices, second-hand housing prices in Shenzhen fell 0.11% month-on-month and 4.86% year-on-year in July. The year-on-year decline was 0.42 percentage points narrower than the previous month.
Figure: Average price of second-hand residential listings in various municipal districts in Shenzhen in July 2026 and the month-on-month ratio
Data source: Middle Index Data CREIS
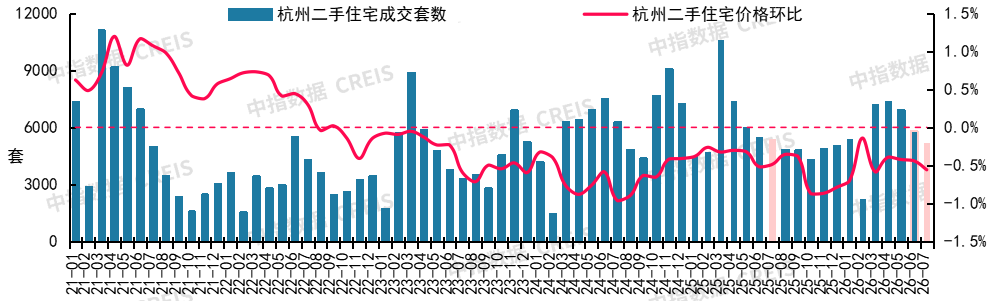
Hangzhou: Second-hand residential transactions fell 4.1% year on year, and the price decline widened slightly
Figure: Month-on-month trend in the number and price of second-hand residential units sold in Hangzhou from January 2021 to July 2026
Data source: Middle Index Data CREIS
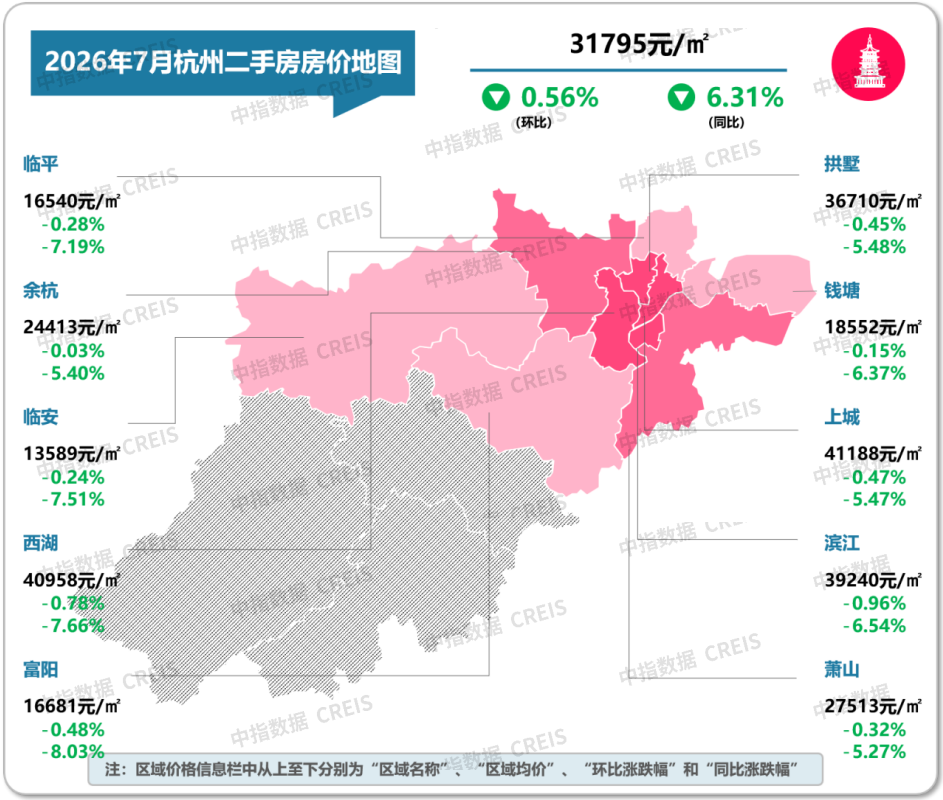
In terms of transactions, in July 2026, 5,189 second-hand residential units were sold in Hangzhou, a year-on-year decrease of 4.1%. In January-July, a total of 40,000 second-hand housing units were sold, a year-on-year decrease of 8.9%. In terms of prices, in July, second-hand housing prices in Hangzhou fell 0.56% month-on-month. The month-on-month decline was 0.12 percentage points higher than the previous month, 6.31% year-on-year, and the year-on-year decline was 0.07 percentage points higher than the previous month.
Figure: Average price of second-hand residential listings in Hangzhou in July 2026 and the month-on-month ratio
Data source: Middle Index Data CREIS
Chengdu: Second-hand housing has maintained a certain level of activity, and the year-on-month decline in prices has increased
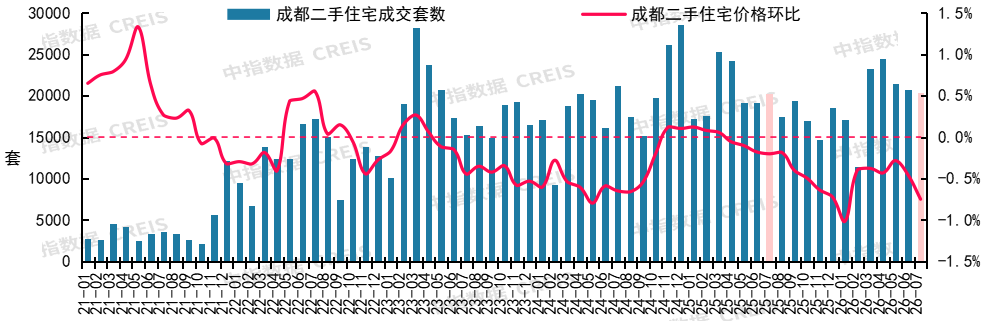
Figure: Month-on-month trend in the number and price of second-hand residential units sold in Chengdu from January 2021 to July 2026
Data source: Middle Index Data CREIS
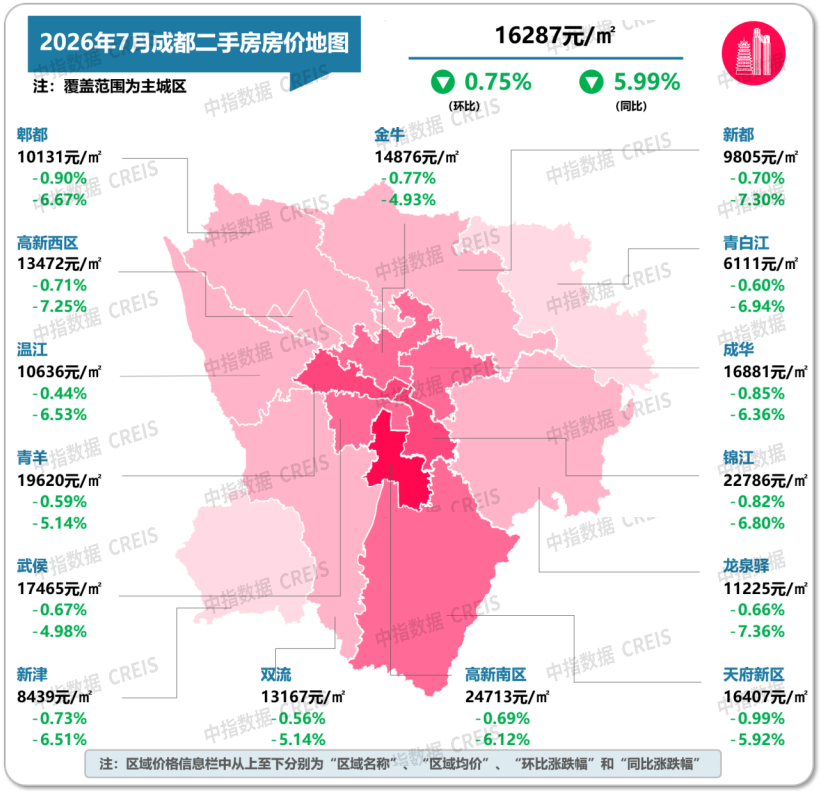
In terms of transactions, in July 2026, 20,400 second-hand residential units were sold in Chengdu, an increase of 1.0% over the previous year. In January-July, a total of 139,000 second-hand housing units were sold, a year-on-year decrease of 2.8%. In terms of prices, second-hand housing prices in Chengdu fell 0.75% month-on-month in July. The month-on-month decline was 0.29 percentage points higher than the previous month, down 5.99% year-on-year, and 0.52 percentage points higher than the previous month.
Figure: Average price of second-hand residential listings in various municipal districts of Chengdu in July 2026 and year-on-month comparison
Data source: Middle Index Data CREIS
Nanjing: The scale of second-hand housing transactions continues to decline, the month-on-month price decline widened, and the year-on-year decline narrowed
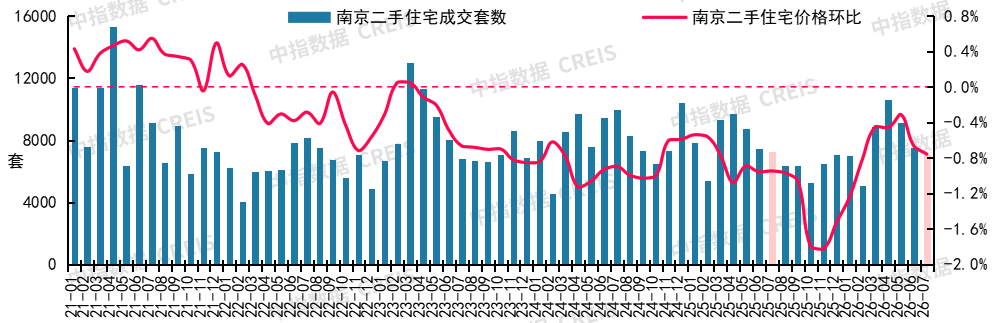
Figure: The month-on-month trend in the number and price of second-hand residential units sold in Nanjing from January 2021 to July 2026
Data source: Middle Index Data CREIS
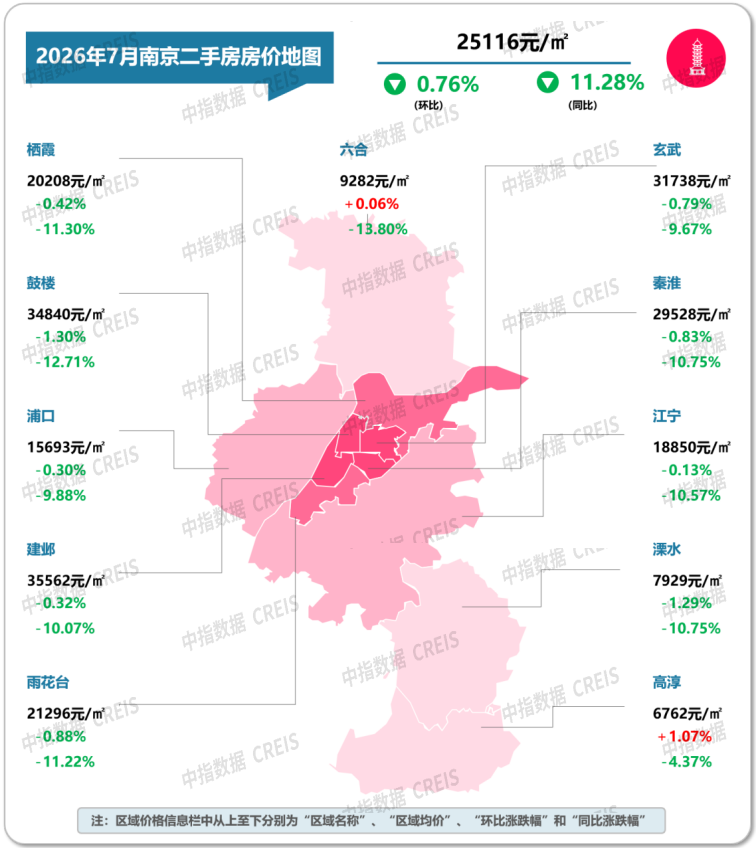
In terms of transactions, in July 2026, 7099 second-hand residential units were sold in Nanjing, a year-on-year decrease of 2.3%. In January-July, a total of 55,000 second-hand housing units were sold, a year-on-year decrease of 0.8%. In terms of prices, second-hand housing prices in Nanjing fell 0.76% month-on-month in July. The month-on-month decline was 0.09 percentage points higher than the previous month, down 11.28% year-on-year, and the year-on-year decline was 0.17 percentage points narrower than the previous month.
Figure: Average price of second-hand residential listings in various municipal districts in Nanjing in July 2026 and the month-on-month ratio
Data source: Middle Index Data CREIS
Wuhan: Second-hand housing sales exceeded 10,000 units for five consecutive months, and prices fell 0.62% month-on-month
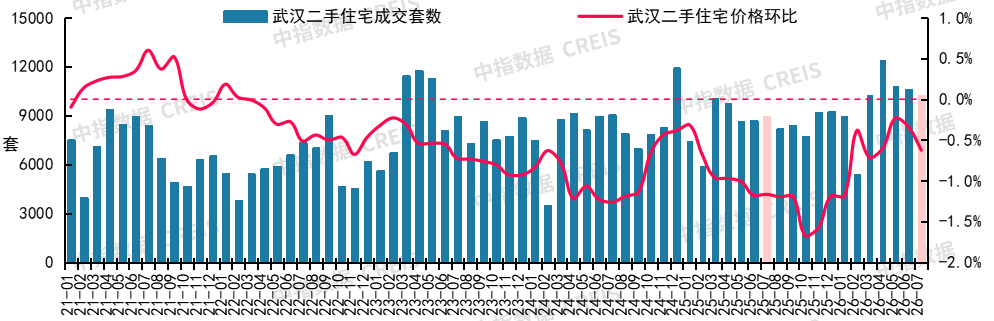
Figure: The month-on-month trend of second-hand housing prices in Wuhan from January 2021 to July 2026
Data source: Middle Index Data CREIS
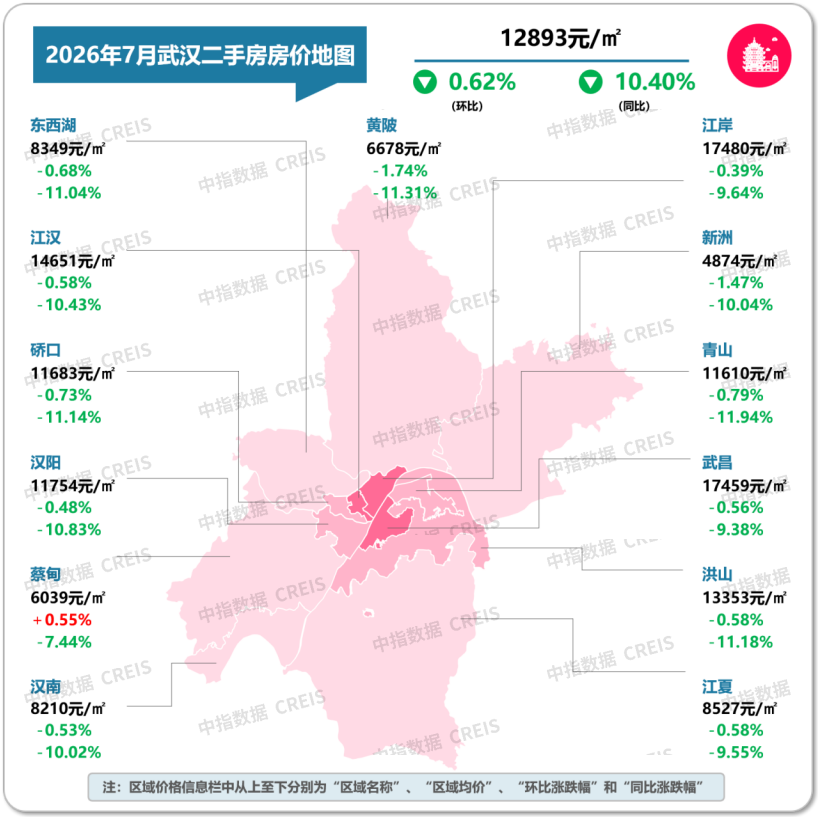
In terms of transactions, in July 2026, 10,254 second-hand residential units were sold in Wuhan, an increase of 14.4% over the previous year. In January-July, a total of 69,000 second-hand housing units were sold, an increase of 15.6% over the previous year. In terms of prices, second-hand housing prices in Wuhan fell 0.62% month-on-month in July. The month-on-month decline was 0.29 percentage points higher than the previous month, down 10.40% year-on-year, and the year-on-year decline was 0.49 percentage points narrower than the previous month.
Figure: Average price of second-hand residential listings in various municipal districts in Wuhan in July 2026 and the month-on-month ratio
Data source: Middle Index Data CREIS
Chongqing (main urban area): Second-hand residential sales volume fell 9.2% year on year, and the month-on-month price decline widened to 0.54%, but the year-on-year decline narrowed by 0.24 percentage points
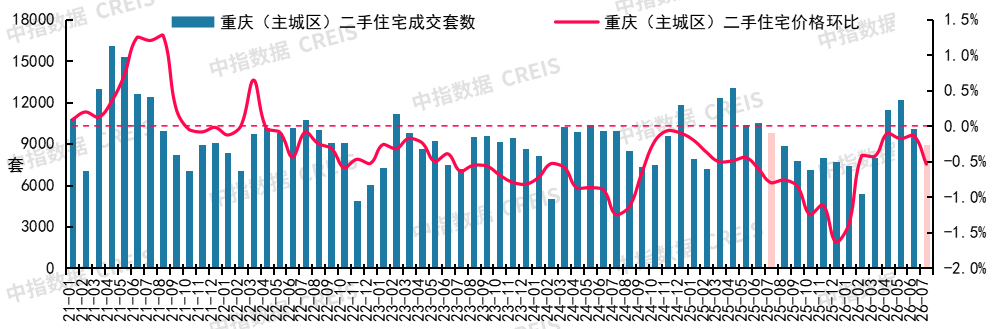
Figure: Month-on-month trend in the number and price of second-hand residential units sold in Chongqing from January 2021 to July 2026
Data source: Middle Index Data CREIS
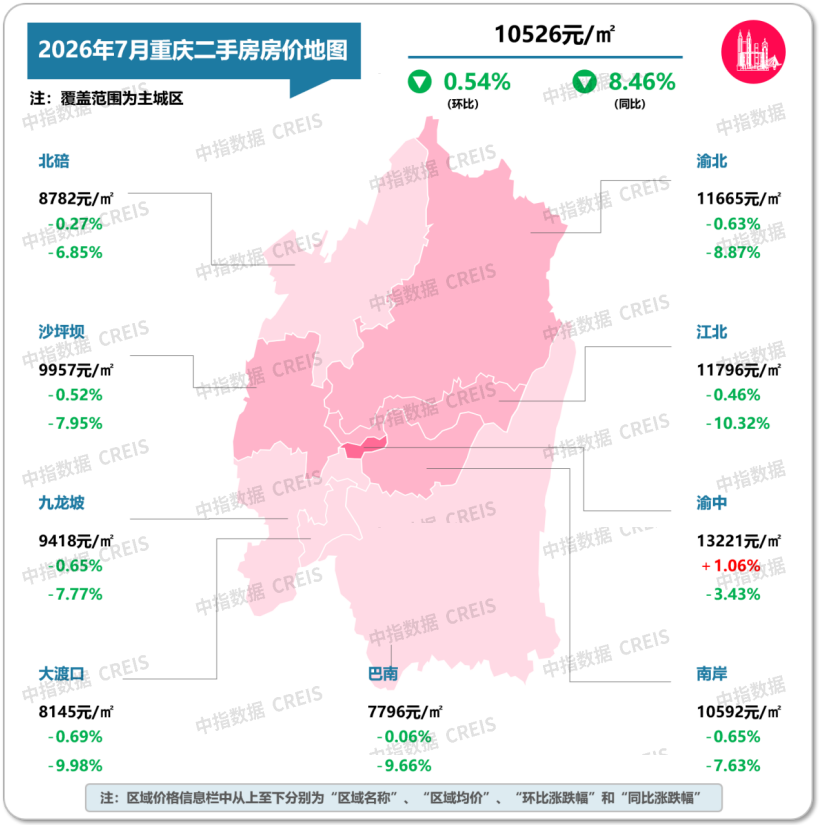
In terms of transactions, in July 2026, 8,937 second-hand residential units were sold in Chongqing, a year-on-year decrease of 9.2%. In January-July, a total of 63,000 second-hand housing units were sold, a year-on-year decrease of 11.1%. In terms of prices, second-hand housing prices in Chongqing fell 0.54% month-on-month in July. The month-on-month decline was 0.41 percentage points higher than the previous month, down 8.46% year-on-year, and the year-on-year decline was 0.24 percentage points narrower than the previous month.
Figure: Average price of second-hand residential listings in Chongqing (main urban area) in July 2026 and the month-on-month ratio
Data source: Middle Index Data CREIS
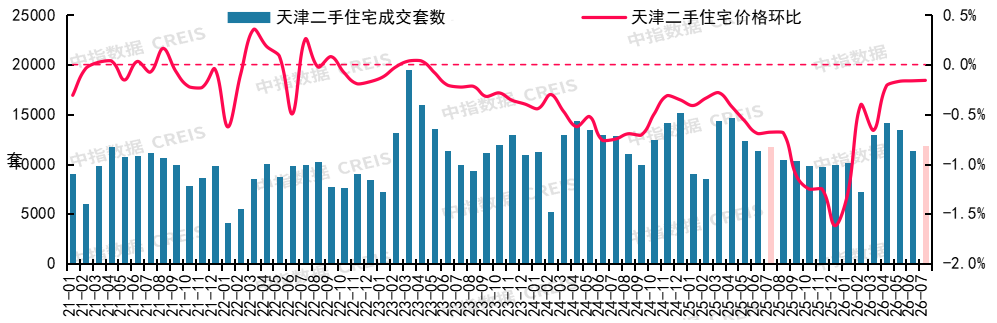
Tianjin: Second-hand residential sales increased month-on-month, and the price decline remained in a narrow range
Figure: The month-on-month trend of second-hand housing prices in Tianjin from January 2021 to July 2026
Data source: Middle Index Data CREIS
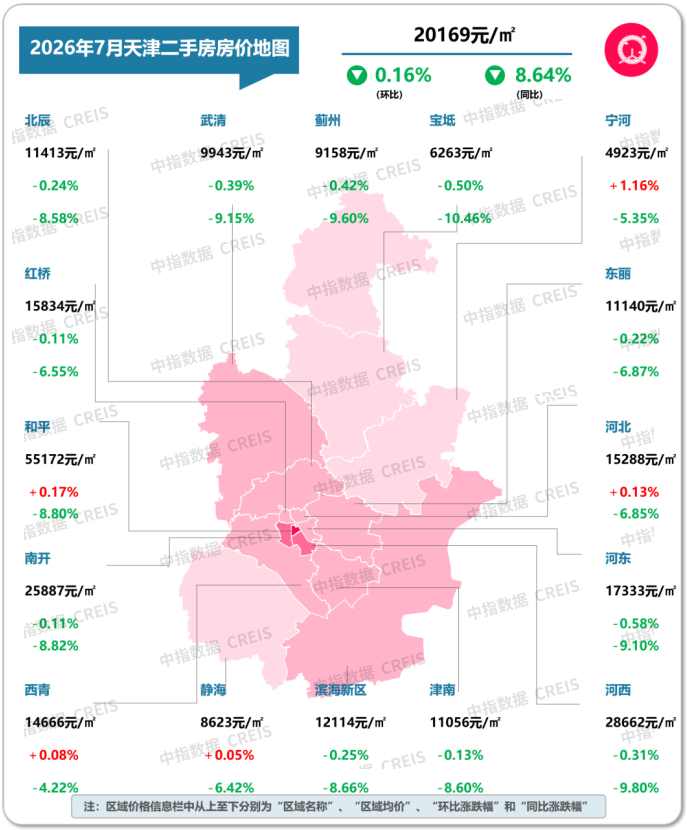
In terms of transactions, in July 2026, 1,1891 second-hand residential units were sold in Tianjin, an increase of 1.3% over the previous year. In January-July, a total of 81,000 second-hand housing units were sold, a year-on-year decrease of 1.1%. In terms of prices, in July, second-hand housing prices in Tianjin fell 0.16% month-on-month. The month-on-month decline was the same as last month. The year-on-year decline was 8.63%, and the year-on-year decline was 0.48 percentage points narrower than the previous month.
Figure: Average price of second-hand residential listings in various municipal districts in Tianjin in July 2026 and the month-on-month ratio
Data source: Middle Index Data CREIS