
- PRICING
- LIVE QUOTES
- LEARN
- HELP


EN
Is CKD (TSE:6407) Fully Valued Following Raised Guidance And Strong First Quarter Results?
CKD (TSE:6407) drew fresh attention on 10 August 2026 after reporting stronger first quarter results and lifting its full year sales, profit and dividend forecasts for the year ending March 2027.
See our latest analysis for CKD.
CKD’s raised guidance and higher dividend forecast come after a strong run, with a year to date share price return of 95.91% and a one year total shareholder return of 147.85%. This suggests momentum has been building ahead of these results.
If you are looking for other potential ideas after CKD’s upgrade, this could be a good time to see what is happening across 37 robotics and automation stocks.
CKD now has stronger guidance, a higher dividend forecast and a share price that has surged this year. The business looks robust. The next question is whether the current valuation already reflects that strength.
Preferred P/E of 24.8x for CKD, is it justified?
On valuation, CKD currently trades on a P/E of 24.8x, which is being applied to a share price of ¥6,220 and reflects a strong run in the stock.
The P/E ratio links the company’s market value to its earnings. For a business like CKD, which has forecast earnings growth and a history of profit expansion, investors often focus on this measure to gauge how much is being paid for each unit of current profit.
Analysts expect CKD’s earnings to grow by 13.2% per year, which is faster than the 8.8% forecast for the broader JP market. The company also reports high quality earnings, with net profit margins at 9.8% compared with 8.4% last year, and earnings growth of 29.8% over the past year against 4.4% per year over five years. In that context, a higher P/E suggests the market is willing to pay more for this earnings profile.
Compared with the JP Machinery industry average P/E of 13.5x, CKD’s 24.8x ratio is considerably higher. It is also above the estimated fair P/E of 23.3x from the fair value model, which indicates the current multiple is slightly richer than the level that model suggests the market could move towards over time.
Explore the SWS fair ratio for CKD
Result: Price-to-earnings of 24.8x (OVERVALUED)
However, there are clear risks if CKD’s earnings growth or margin profile softens, or if sector sentiment cools and investors reassess paying a premium P/E.
Find out about the key risks to this CKD narrative.
Another view on CKD using the SWS DCF model
The earlier discussion focused on CKD’s 24.8x P/E, which looks rich against both the JP Machinery industry and the fair ratio of 23.3x. However, the SWS DCF model offers a different lens. It points to a value of ¥4,788.02 per share, which is below today’s ¥6,220 price and signals an overvalued reading on future cash flows.
That leaves you with two tools pointing in the same direction but for different reasons: earnings and cash flows. The real question is which one you trust more if CKD’s story changes from here and how comfortable you are paying up at this level.
Look into how the SWS DCF model arrives at its fair value.
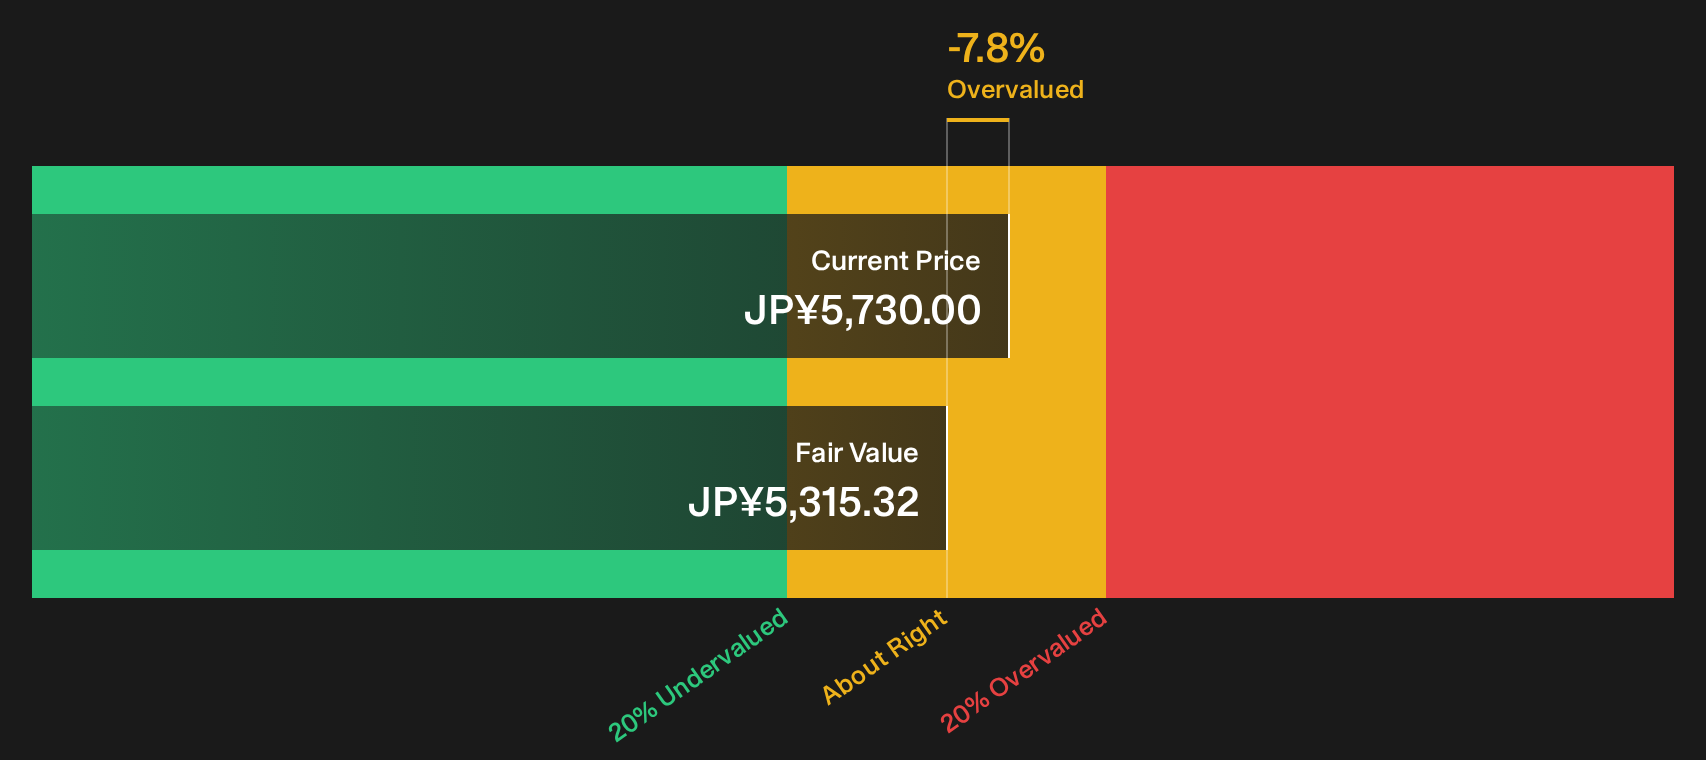
Simply Wall St performs a discounted cash flow (DCF) on every stock in the world every day (check out CKD for example). We show the entire calculation in full. You can track the result in your watchlist or portfolio and be alerted when this changes, or use our stock screener to discover 23 high quality undervalued stocks. If you save a screener we even alert you when new companies match - so you never miss a potential opportunity.
Next Steps
With CKD now looking stronger on several fronts, it makes sense to move quickly and test whether the current price really fits your risk and reward comfort level. To weigh both sides of the story in one place, start with the 2 key rewards and 2 important warning signs.
Looking for more investment ideas beyond CKD?
Once you have a view on CKD, do not stop there. Use the screener to spot fresh opportunities that fit your goals and avoid leaving potential ideas on the table.
- Target potential value opportunities by checking stocks highlighted in the 23 high quality undervalued stocks.
- Focus on income ideas by reviewing companies featured in the 33 dividend fortresses.
- Prioritise resilience by scanning stocks in the 59 resilient stocks with low risk scores.
This article by Simply Wall St is general in nature. We provide commentary based on historical data and analyst forecasts only using an unbiased methodology and our articles are not intended to be financial advice. It does not constitute a recommendation to buy or sell any stock, and does not take account of your objectives, or your financial situation. We aim to bring you long-term focused analysis driven by fundamental data. Note that our analysis may not factor in the latest price-sensitive company announcements or qualitative material. Simply Wall St has no position in any stocks mentioned.
Have feedback on this article? Concerned about the content? Get in touch with us directly. Alternatively, email editorial-team@simplywallst.com