
- PRICING
- LIVE QUOTES
- LEARN
- HELP


EN
Shandong Weifang Rainbow Chemical And 2 Other Undiscovered Gems In Asia To Enhance Your Portfolio
Amidst a backdrop of easing inflation concerns and mixed performance in major indices like the S&P MidCap 400 and Russell 2000, the Asian market continues to present intriguing opportunities for investors seeking to diversify their portfolios. In this environment, identifying stocks with strong fundamentals and growth potential can be crucial for enhancing portfolio performance, as exemplified by companies such as Shandong Weifang Rainbow Chemical.
Top 10 Undiscovered Gems With Strong Fundamentals In Asia
| Name | Debt To Equity | Revenue Growth | Earnings Growth | Health Rating |
|---|---|---|---|---|
| Vector | 29.84% | 7.98% | 22.15% | ★★★★★★ |
| DeHua TB New Decoration MaterialLtd | 0.63% | 1.50% | 2.14% | ★★★★★★ |
| Beijing Chunlizhengda Medical Instruments | NA | -2.67% | -10.59% | ★★★★★★ |
| Kyosan Electric Manufacturing | 46.17% | 7.20% | 17.51% | ★★★★★★ |
| Base | NA | 11.66% | 17.63% | ★★★★★★ |
| CNMC Goldmine Holdings | 2.29% | 35.67% | 73.16% | ★★★★★☆ |
| Zhejiang Jolly PharmaceuticalLTD | 21.31% | 17.83% | 29.70% | ★★★★★☆ |
| uSonar | 5.92% | 15.94% | 37.41% | ★★★★★☆ |
| Sing Investments & Finance | 0.10% | 5.85% | 7.00% | ★★★★☆☆ |
| Shengda ResourcesLtd | 57.58% | 8.61% | 9.90% | ★★★☆☆☆ |
Underneath we present a selection of stocks filtered out by our screen.
Shandong Weifang Rainbow Chemical (SZSE:301035)
Simply Wall St Value Rating: ★★★★★☆
Overview: Shandong Weifang Rainbow Chemical Co., Ltd is a Chinese company specializing in crop protection, with a market capitalization of CN¥18.91 billion.
Operations: Rainbow Chemical generates revenue primarily from its crop protection products. The company's financial performance is highlighted by a net profit margin of 11.5%.
Rainbow Chemical, a promising player in the chemicals sector, has seen its earnings soar by 72% over the past year, outperforming the industry average of 4.6%. Its debt to equity ratio rose from 24.2% to 37.1% over five years, but interest payments are comfortably covered with an EBIT coverage of 81 times. The company trades at a significant discount of about 77.5% below estimated fair value and boasts high-quality earnings with positive free cash flow. Recent changes in bylaws and capital adjustments reflect strategic shifts aimed at enhancing operational flexibility and potential growth prospects.

Shenzhen Uniconn Technology (SZSE:301631)
Simply Wall St Value Rating: ★★★★★★
Overview: Shenzhen Uniconn Technology Co., Ltd. specializes in the research, design, production, sale, and service of electrical connection components in China with a market capitalization of CN¥8.94 billion.
Operations: Uniconn generates revenue primarily from the sale of electrical connection components, amounting to CN¥5.51 billion. The company's financial performance is characterized by its focus on this singular revenue stream.
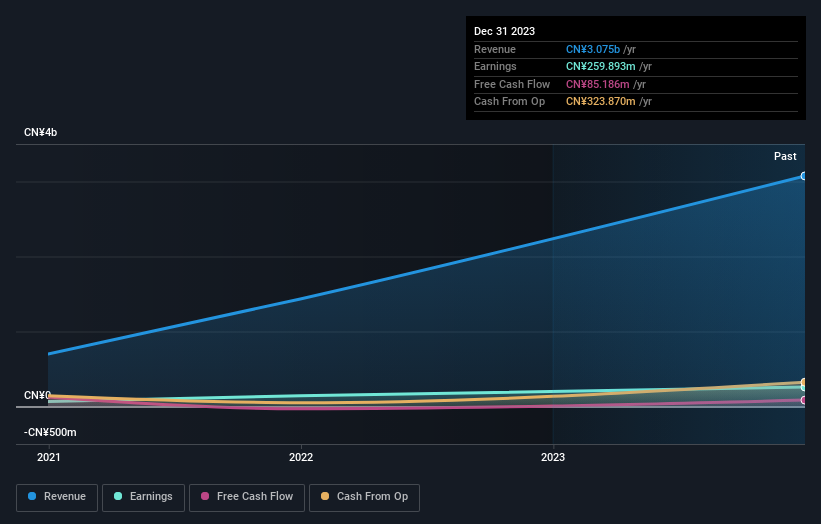
Shenzhen Uniconn Technology, a nimble player in the tech sector, has showcased impressive growth with earnings surging by 30% over the past year, outpacing the electronic industry's 10% rise. Its strategic financial management is evident as its debt-to-equity ratio decreased from 18.5 to 6.5 over five years, and it trades at a value significantly below fair estimates by about 52%. The company recently announced a dividend of CNY 10 per share for A shares and plans an extraordinary meeting on August 20 to discuss changes in company bylaws, indicating proactive governance and shareholder engagement.
gremsInc (TSE:3150)
Simply Wall St Value Rating: ★★★★★★
Overview: grems, Inc. operates in the energy solution and electricity retailing sectors in Japan with a market capitalization of ¥58.04 billion.
Operations: The company generates revenue primarily from its energy solution and electricity retailing businesses. It has a market capitalization of ¥58.04 billion, reflecting its scale within these sectors in Japan.
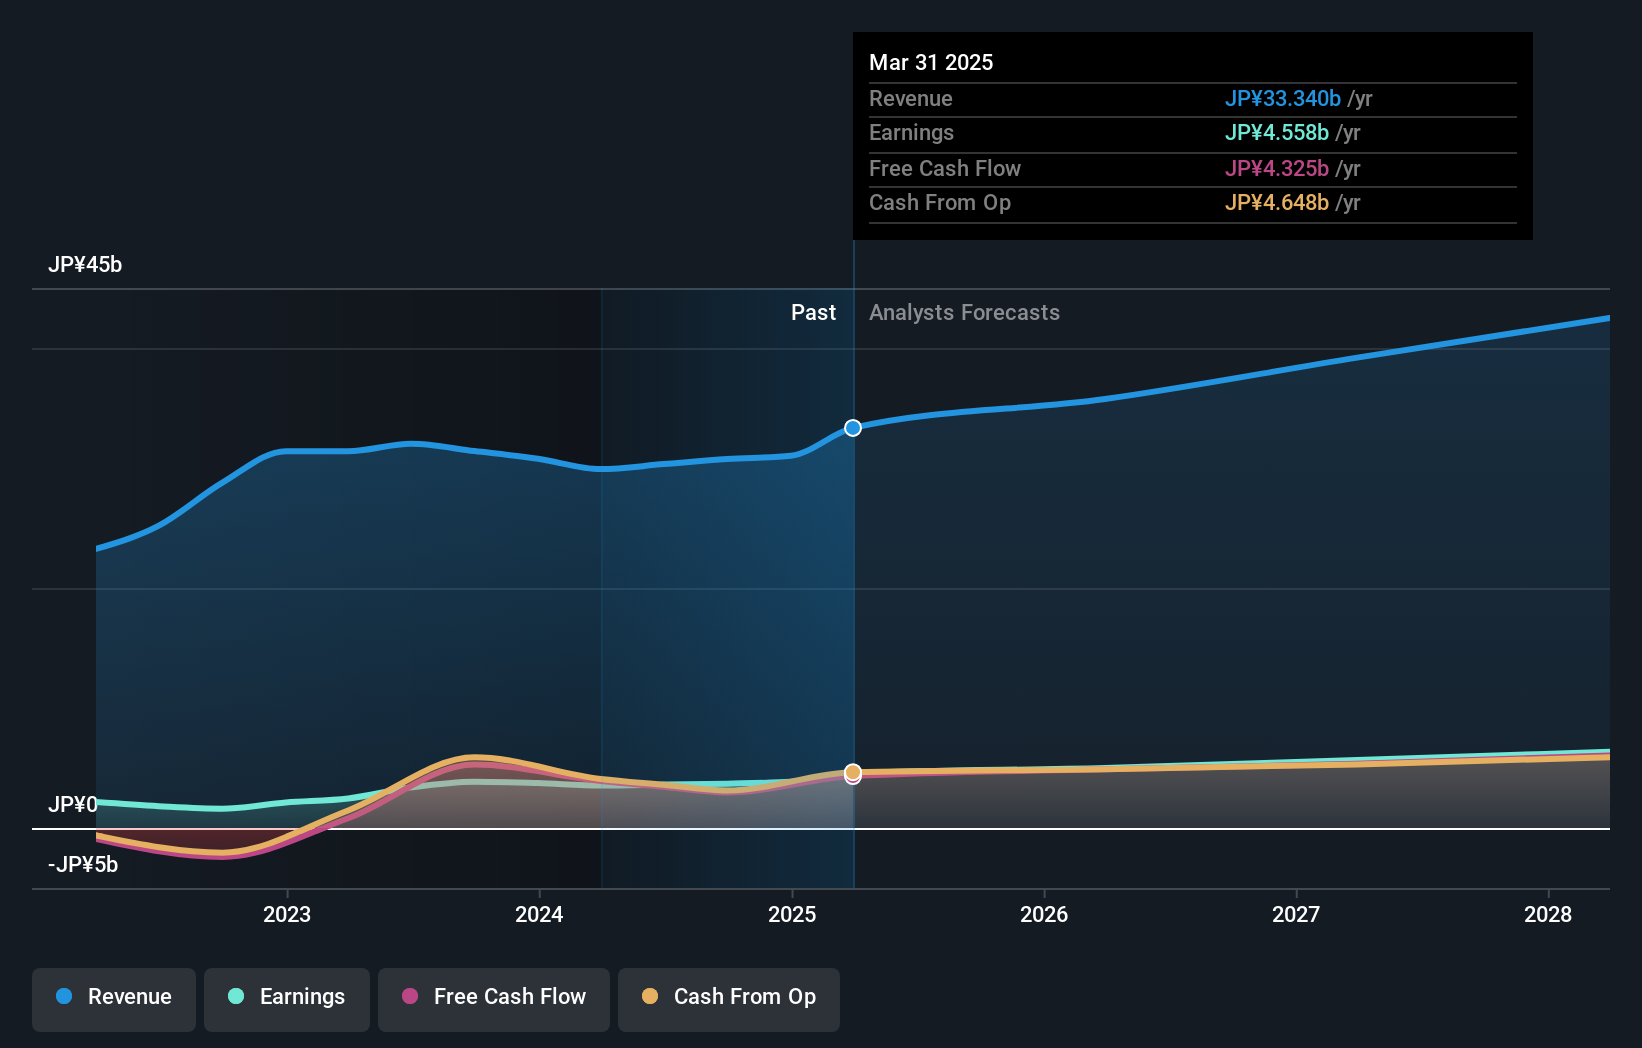
gremsInc. is making waves with its impressive financial metrics and strategic moves. Over the past year, earnings have grown by 9.1%, outpacing the Commercial Services industry growth of 7.6%. This company trades at a notable 48.8% below its estimated fair value, presenting an attractive opportunity for investors seeking value in Asia's market landscape. The debt to equity ratio has improved significantly from 30.5% to 17.1% over five years, indicating a stronger balance sheet position now than before, while free cash flow remains positive at ¥3 billion as of September 2026, reinforcing its robust financial health and potential for future growth.
- Navigate through the intricacies of gremsInc with our comprehensive health report here.
Gain insights into gremsInc's past trends and performance with our Past report.
Make It Happen
- Get an in-depth perspective on all 117 Asian Undiscovered Gems With Strong Fundamentals by using our screener here.
- Are you invested in these stocks already? Keep abreast of every twist and turn by setting up a portfolio with Simply Wall St, where we make it simple for investors like you to stay informed and proactive.
- Unlock the power of informed investing with Simply Wall St, your free guide to navigating stock markets worldwide.
Ready For A Different Approach?
- Explore high-performing small cap companies that haven't yet garnered significant analyst attention.
- Fuel your portfolio with companies showing strong growth potential, backed by optimistic outlooks both from analysts and management.
- Find companies with promising cash flow potential yet trading below their fair value.
This article by Simply Wall St is general in nature. We provide commentary based on historical data and analyst forecasts only using an unbiased methodology and our articles are not intended to be financial advice. It does not constitute a recommendation to buy or sell any stock, and does not take account of your objectives, or your financial situation. We aim to bring you long-term focused analysis driven by fundamental data. Note that our analysis may not factor in the latest price-sensitive company announcements or qualitative material. Simply Wall St has no position in any stocks mentioned.
Have feedback on this article? Concerned about the content? Get in touch with us directly. Alternatively, email editorial-team@simplywallst.com