
- PRICING
- LIVE QUOTES
- LEARN
- HELP


EN
3 UK Dividend Stocks With Yields Up To 6.5%
The UK market has recently faced challenges, with the FTSE 100 index experiencing declines due to weak trade data from China, highlighting the interconnectedness of global economies. In such a climate, dividend stocks can offer a measure of stability and income potential for investors seeking to navigate uncertain times.
Top 10 Dividend Stocks In The United Kingdom
| Name | Dividend Yield | Dividend Rating |
| Telecom Plus (LSE:TEP) | 5.85% | ★★★★★☆ |
| Pollen Street Group (LSE:POLN) | 6.72% | ★★★★★☆ |
| Multitude (LSE:0R4W) | 9.26% | ★★★★★☆ |
| MONY Group (LSE:MONY) | 6.07% | ★★★★★★ |
| James Halstead (AIM:JHD) | 6.63% | ★★★★★☆ |
| IG Group Holdings (LSE:IGG) | 3.54% | ★★★★★☆ |
| Dunelm Group (LSE:DNLM) | 7.85% | ★★★★★☆ |
| BTG Consulting (AIM:BTG) | 4.30% | ★★★★★☆ |
| 4imprint Group (LSE:FOUR) | 3.76% | ★★★★★☆ |
| 3i Group (LSE:III) | 3.03% | ★★★★★☆ |
Click here to see the full list of 48 stocks from our Top UK Dividend Stocks screener.
Let's dive into some prime choices out of the screener.
Aviva (LSE:AV.)
Simply Wall St Dividend Rating: ★★★★☆☆
Overview: Aviva plc offers insurance, retirement, and wealth products across the United Kingdom, Ireland, Canada, India, and China with a market cap of £21.73 billion.
Operations: Aviva plc's revenue is primarily derived from its UK & Ireland General Insurance (£14.08 billion), Insurance, Wealth & Retirement (£11.24 billion), and Canada General Insurance (£4.50 billion) segments, complemented by contributions from Aviva Investors (£424 million) and International Investments in India and China (£131 million).
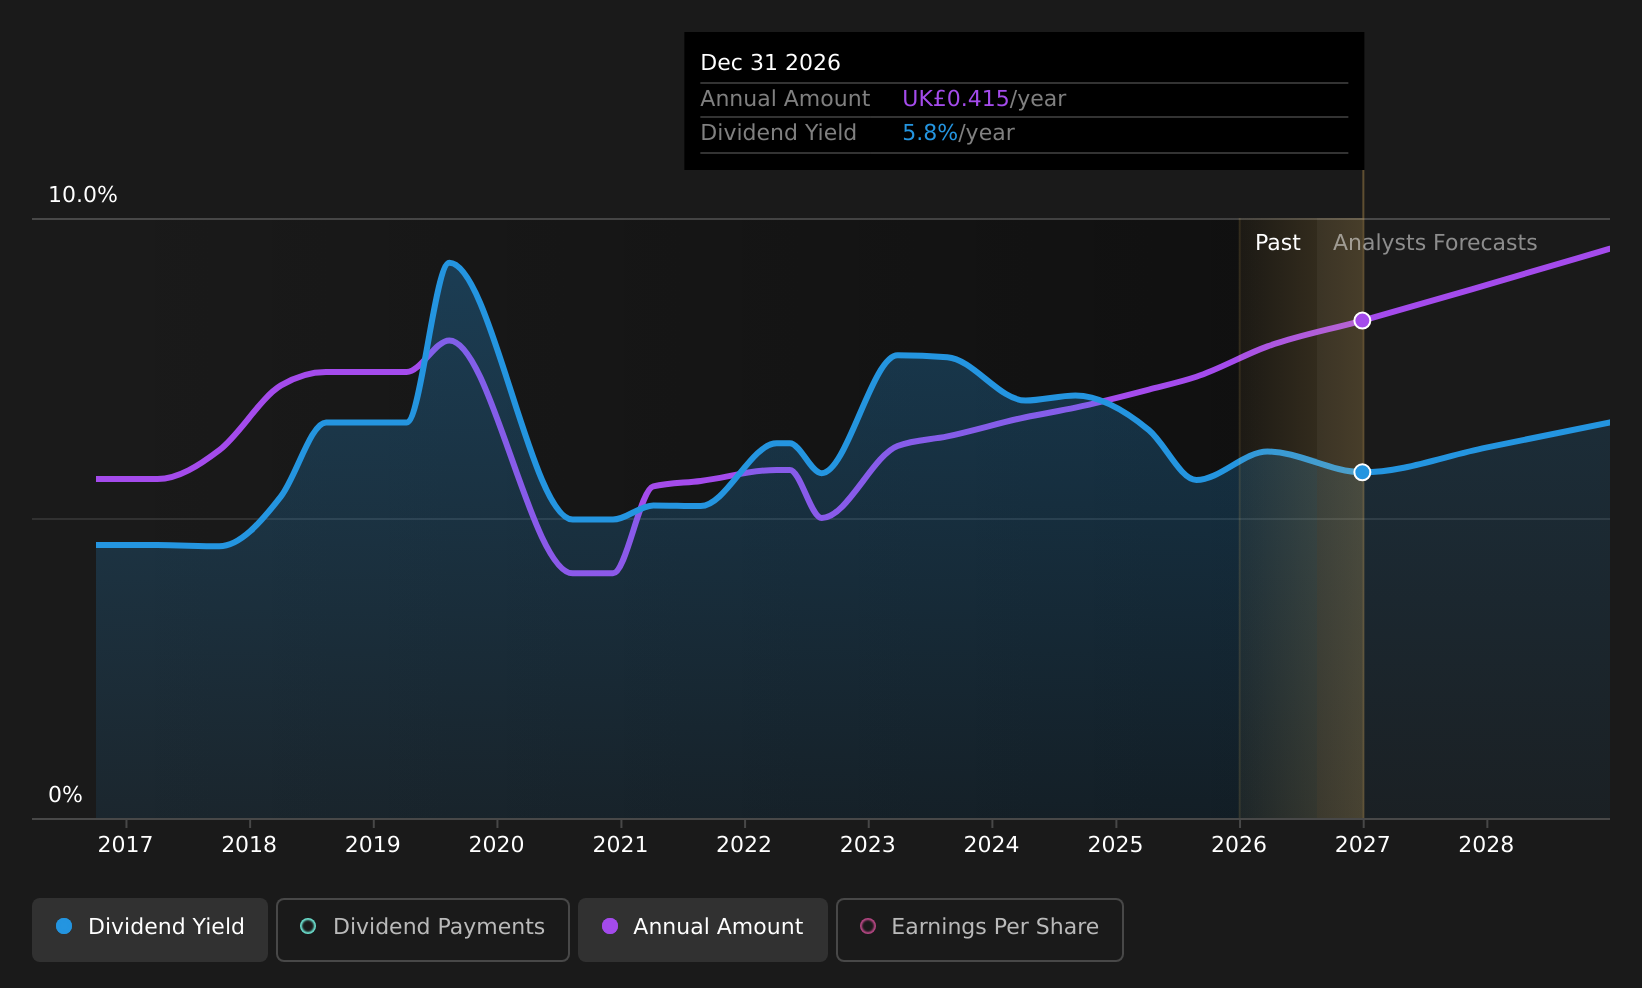
Dividend Yield: 5.4%
Aviva's dividend yield of 5.41% is among the top 25% in the UK market, yet its high payout ratio of 218.4% indicates dividends are not well covered by earnings, though cash flows cover them with a low cash payout ratio of 24.2%. Despite a history of volatility and unreliability in dividends over the past decade, Aviva has increased its dividend payments during this period. Recent earnings show net income fell to £407 million from £698 million year-on-year.
- Unlock comprehensive insights into our analysis of Aviva stock in this dividend report.
- Our valuation report unveils the possibility Aviva's shares may be trading at a premium.
Kainos Group (LSE:KNOS)
Simply Wall St Dividend Rating: ★★★★☆☆
Overview: Kainos Group plc provides information technology services across the United Kingdom, Ireland, North America, Central Europe, and internationally, with a market cap of approximately £1.13 billion.
Operations: Kainos Group's revenue is primarily derived from Digital Services (£241.74 million), Workday Products (£81.75 million), and Workday Services (£107.61 million).
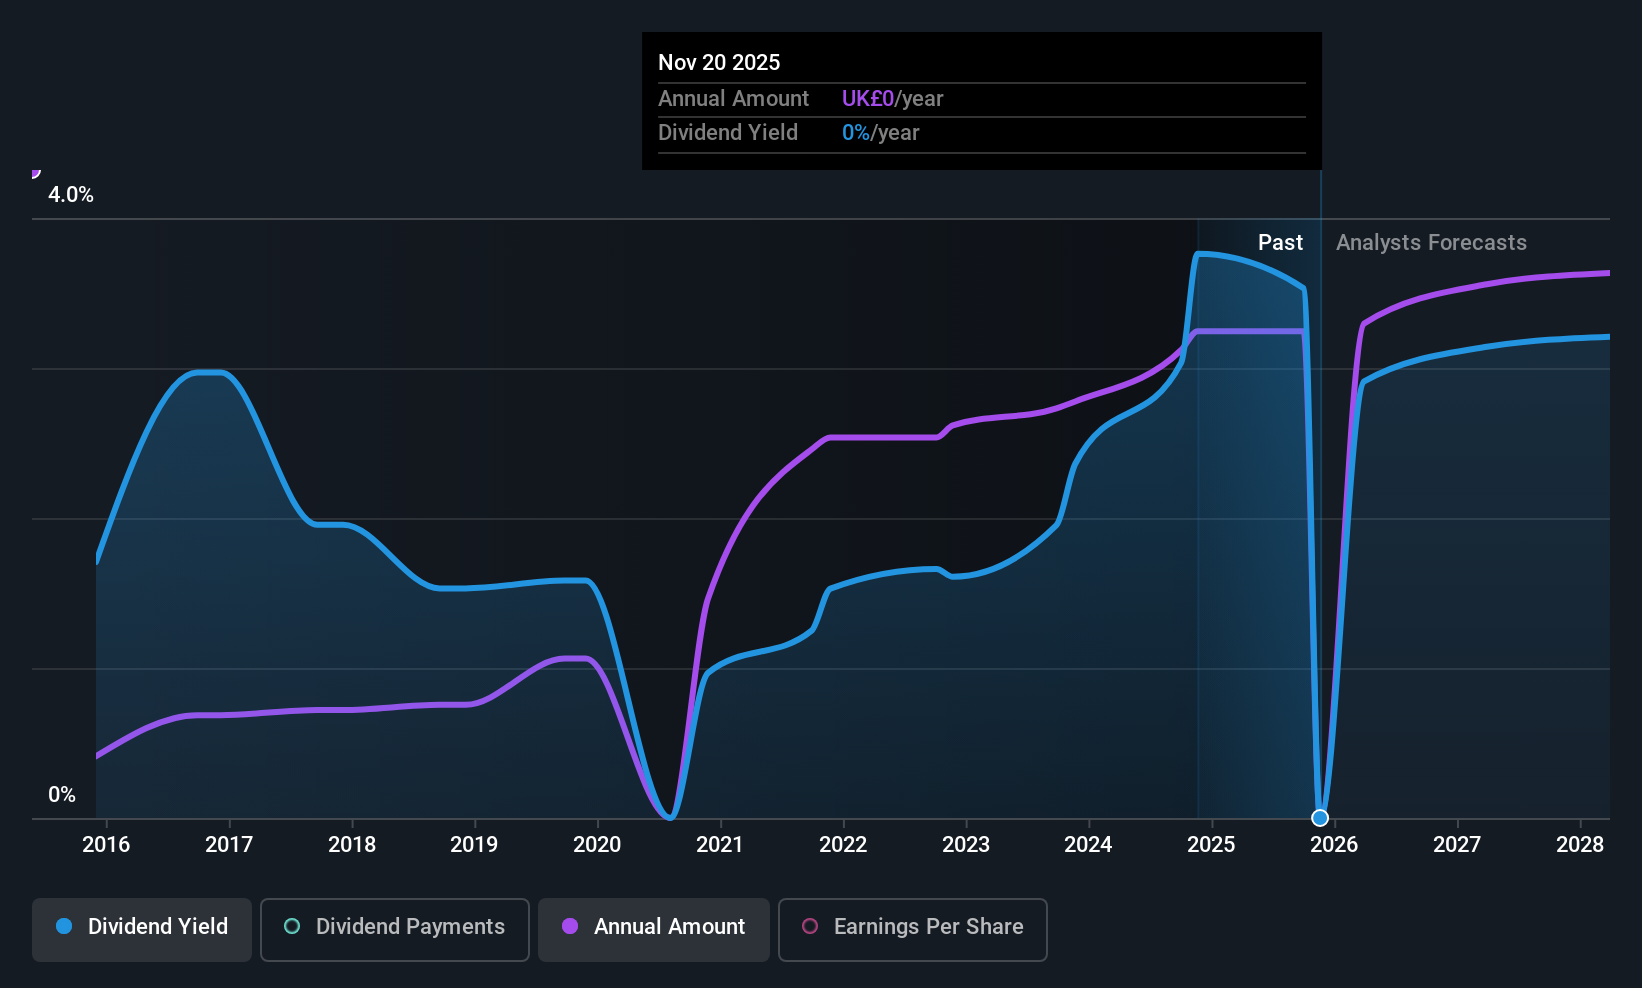
Dividend Yield: 3.1%
Kainos Group's dividend payments are covered by earnings and cash flows, with a payout ratio of 83.4% and a cash payout ratio of 69.3%. Despite past volatility and unreliability in dividends, the company has increased its annual dividend to 29.6 pence for the year ending March 31, 2026. Earnings grew by £6.94 million from the previous year, indicating profitability improvements despite insider selling concerns. However, its current yield of 3.05% is below top-tier UK dividend payers.
- Navigate through the intricacies of Kainos Group with our comprehensive dividend report here.
- In light of our recent valuation report, it seems possible that Kainos Group is trading behind its estimated value.
PayPoint (LSE:PAY)
Simply Wall St Dividend Rating: ★★★★☆☆
Overview: PayPoint plc provides payments and banking, shopping, and e-commerce services and products in the United Kingdom and New Zealand, with a market cap of £366.49 million.
Operations: PayPoint plc generates revenue through its Love2shop segment, which contributes £158.23 million, and the Pay Point segment, which adds £178.78 million.
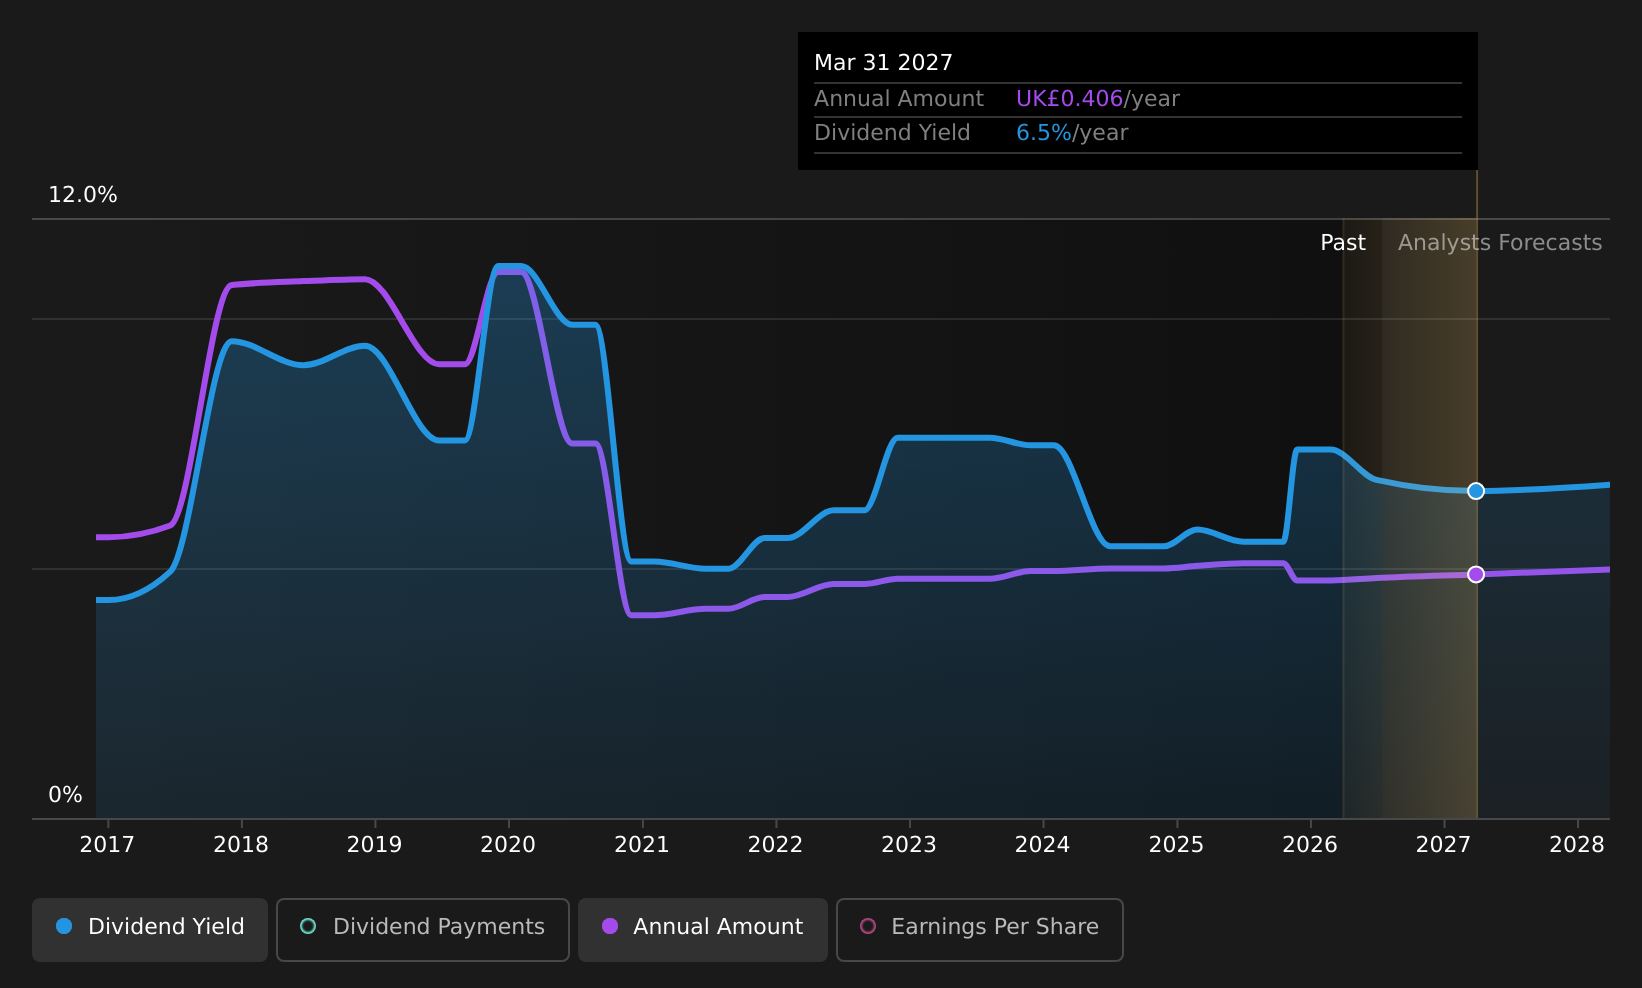
Dividend Yield: 6.6%
PayPoint offers a dividend yield in the top 25% of UK payers, with dividends covered by earnings (67.4% payout ratio) and cash flows (24% cash payout ratio). Despite past volatility and unreliability, it recently increased its final dividend to 20 pence per share. Earnings have significantly improved, doubling net income to £39.33 million from the previous year. However, recent executive changes may impact future stability. The stock trades below estimated fair value, enhancing its appeal as a potential investment option.
- Get an in-depth perspective on PayPoint's performance by reading our dividend report here.
- Upon reviewing our latest valuation report, PayPoint's share price might be too pessimistic.
Turning Ideas Into Actions
- Embark on your investment journey to our 48 Top UK Dividend Stocks selection here.
- Already own these companies? Link your portfolio to Simply Wall St and get alerts on any new warning signs to your stocks.
- Maximize your investment potential with Simply Wall St, the comprehensive app that offers global market insights for free.
Searching for a Fresh Perspective?
- Explore high-performing small cap companies that haven't yet garnered significant analyst attention.
- Fuel your portfolio with companies showing strong growth potential, backed by optimistic outlooks both from analysts and management.
- Find companies with promising cash flow potential yet trading below their fair value.
This article by Simply Wall St is general in nature. We provide commentary based on historical data and analyst forecasts only using an unbiased methodology and our articles are not intended to be financial advice. It does not constitute a recommendation to buy or sell any stock, and does not take account of your objectives, or your financial situation. We aim to bring you long-term focused analysis driven by fundamental data. Note that our analysis may not factor in the latest price-sensitive company announcements or qualitative material. Simply Wall St has no position in any stocks mentioned.
Have feedback on this article? Concerned about the content? Get in touch with us directly. Alternatively, email editorial-team@simplywallst.com