
- PRICING
- LIVE QUOTES
- LEARN
- HELP


EN
European Stocks Trading Below Estimated Value For August 2026
As the European market navigates a landscape marked by resilient economic data and geopolitical uncertainties, the STOXX Europe 600 Index recently closed slightly lower, reflecting investor caution amid these mixed signals. Despite these challenges, opportunities may exist for investors seeking undervalued stocks that could benefit from current sector shifts and regional economic resilience. In this context, identifying stocks trading below their estimated value can be particularly appealing as they may offer potential for growth when market conditions stabilize or improve.
Top 10 Undervalued Stocks Based On Cash Flows In Europe
| Name | Current Price | Fair Value (Est) | Discount (Est) |
| ZEAL Network (XTRA:TIMA) | €43.50 | €86.96 | 50% |
| thyssenkrupp nucera KGaA (XTRA:NCH2) | €7.91 | €15.74 | 49.7% |
| RENK Group (XTRA:R3NK) | €51.69 | €102.11 | 49.4% |
| New Wave Group (OM:NEWA B) | SEK92.35 | SEK183.13 | 49.6% |
| Murapol (WSE:MUR) | PLN38.80 | PLN77.11 | 49.7% |
| Micro Systemation (OM:MSAB B) | SEK89.40 | SEK177.35 | 49.6% |
| Generic Sweden (OM:GENI) | SEK40.15 | SEK80.18 | 49.9% |
| Dynavox Group (OM:DYVOX) | SEK74.70 | SEK147.84 | 49.5% |
| Diagnostic Medical Systems (ENXTPA:ALDMS) | €1.07 | €2.13 | 49.8% |
| cBrain (CPSE:CBRAIN) | DKK52.80 | DKK104.54 | 49.5% |
Let's dive into some prime choices out of the screener.
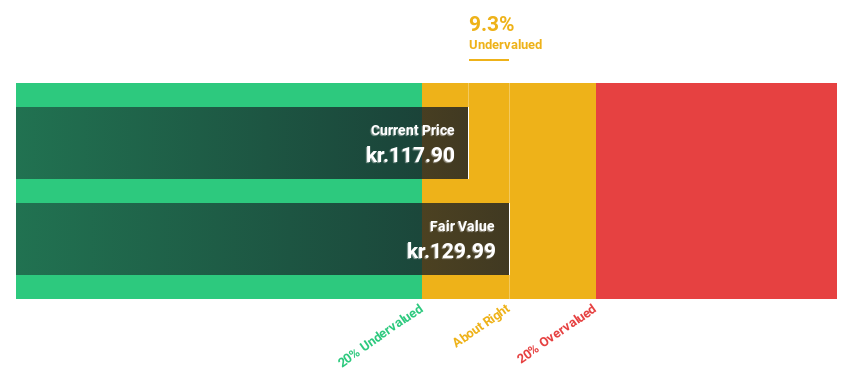
Ambu (CPSE:AMBU B)
Overview: Ambu A/S, along with its subsidiaries, is engaged in the research, development, manufacturing, marketing, and sale of medical technology solutions across North America, Europe, and other international markets; it has a market cap of DKK20.20 billion.
Operations: The company's revenue is primarily derived from its Medical Technology Solutions segment, which generated DKK6.10 billion.
Estimated Discount To Fair Value: 47.8%
Ambu is trading at DKK76.55, significantly below its estimated future cash flow value of DKK146.57, indicating it is undervalued based on cash flows. Earnings are forecast to grow at 23.42% annually over the next three years, outpacing both revenue growth and the Danish market average. Despite strong profit growth and a low trading valuation, Ambu's return on equity is expected to remain modest at 13.5%.
- Insights from our recent growth report point to a promising forecast for Ambu's business outlook.
- Click here and access our complete balance sheet health report to understand the dynamics of Ambu.
SMA Solar Technology (XTRA:S92)
Overview: SMA Solar Technology AG, along with its subsidiaries, develops, produces, and sells PV and battery inverters, monitoring systems for PV systems, and charging solutions for electric vehicles both in Germany and internationally; it has a market cap of €2.01 billion.
Operations: The company's revenue is primarily derived from two segments: Home and Business Solutions, which generated €275.60 million, and Large Scale & Project Solutions, contributing €1.24 billion.
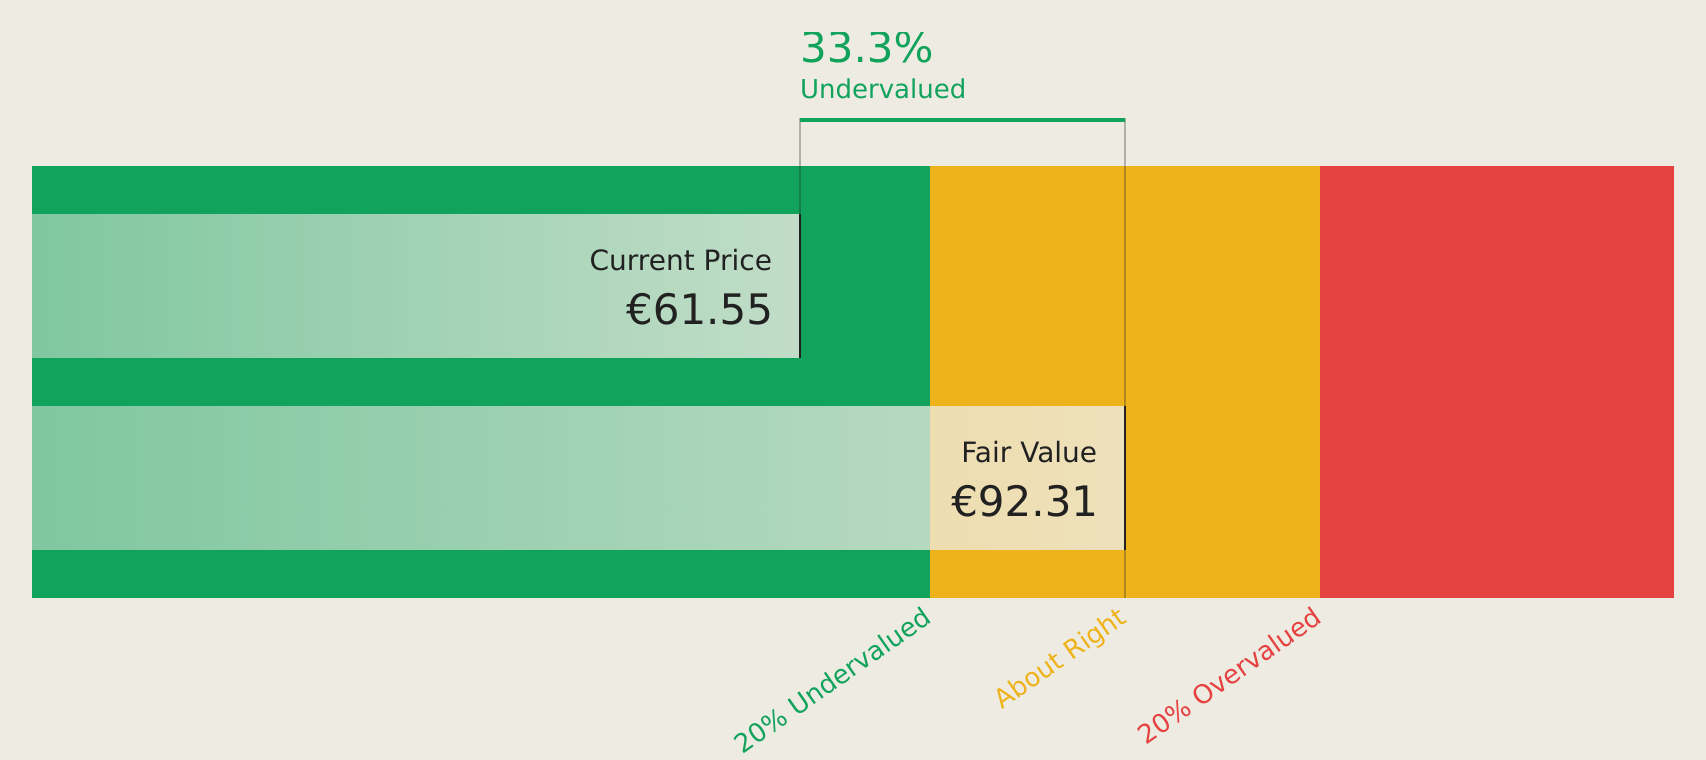
Estimated Discount To Fair Value: 36.6%
SMA Solar Technology is trading at €58, significantly below its estimated future cash flow value of €91.44, highlighting its undervaluation. The company reported a second-quarter net income of €74.38 million, reversing a net loss from the previous year. Earnings per share improved to €2.14 from a loss per share of €1.38 last year. Forecasts suggest earnings will grow 63.75% annually and revenue will increase faster than the German market average at 8.3% per year.
- The analysis detailed in our SMA Solar Technology growth report hints at robust future financial performance.
- Navigate through the intricacies of SMA Solar Technology with our comprehensive financial health report here.
Vincorion (XTRA:V1NC)
Overview: Vincorion SE develops and manufactures power and mechatronic solutions for defense platforms and aviation systems in Germany and internationally, with a market cap of €1.11 billion.
Operations: The company generates revenue through its development and manufacturing of power and mechatronic solutions for defense platforms and aviation systems both domestically in Germany and on an international scale.
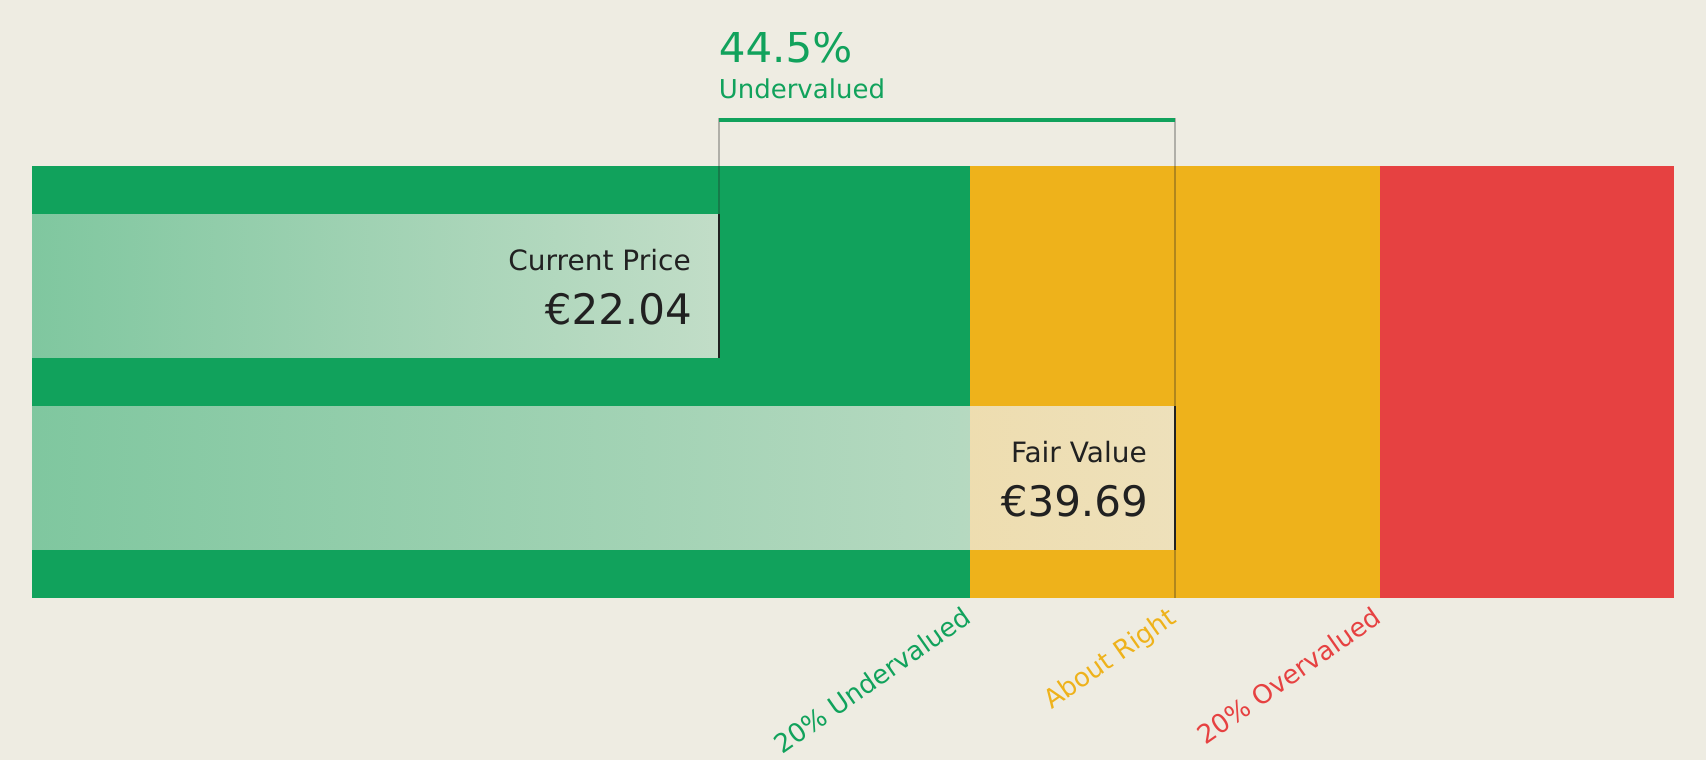
Estimated Discount To Fair Value: 43.6%
Vincorion SE's stock is trading at €22.25, well below its estimated future cash flow value of €39.42, marking it as undervalued based on cash flows. Recent earnings results show a significant increase in net income to €16.91 million for H1 2026 from €9.76 million the previous year, with sales rising to €150.24 million from €105.5 million year-over-year. The company secured substantial contracts totaling over €74 million in June alone, supporting strong revenue growth forecasts of 14.1% annually, outpacing the German market average of 6.8%.
- According our earnings growth report, there's an indication that Vincorion might be ready to expand.
- Dive into the specifics of Vincorion here with our thorough financial health report.
Seize The Opportunity
- Explore the 218 names from our Undervalued European Stocks Based On Cash Flows screener here.
- Already own these companies? Link your portfolio to Simply Wall St and get alerts on any new warning signs to your stocks.
- Maximize your investment potential with Simply Wall St, the comprehensive app that offers global market insights for free.
Ready To Venture Into Other Investment Styles?
- Explore high-performing small cap companies that haven't yet garnered significant analyst attention.
- Diversify your portfolio with solid dividend payers offering reliable income streams to weather potential market turbulence.
- Fuel your portfolio with companies showing strong growth potential, backed by optimistic outlooks both from analysts and management.
This article by Simply Wall St is general in nature. We provide commentary based on historical data and analyst forecasts only using an unbiased methodology and our articles are not intended to be financial advice. It does not constitute a recommendation to buy or sell any stock, and does not take account of your objectives, or your financial situation. We aim to bring you long-term focused analysis driven by fundamental data. Note that our analysis may not factor in the latest price-sensitive company announcements or qualitative material. Simply Wall St has no position in any stocks mentioned.
Have feedback on this article? Concerned about the content? Get in touch with us directly. Alternatively, email editorial-team@simplywallst.com