
- PRICING
- LIVE QUOTES
- LEARN
- HELP


EN
Peab (OM:PEAB B) Wins New Nordic Contracts, Is The Stock Still Cheap?
Peab stock reacts to new Nordic public sector contracts
Peab (OM:PEAB B) has attracted fresh investor attention after securing two public sector projects in Finland and Norway worth a combined SEK 287 million, expanding its healthcare and education construction workload.
See our latest analysis for Peab.
These new public sector contracts arrive after a 30 day share price return of 8.42% and a year to date share price return of 9.55% for Peab. The 1 year total shareholder return stands at 30.96% and the 3 year total shareholder return at 131.72%, suggesting momentum that investors appear to be reassessing alongside the company’s order book and risk profile.
If you are looking beyond Nordic construction and want to see what else is gaining attention in infrastructure related themes, it could be worth scanning 36 power grid technology and infrastructure stocks
Peab now has fresh public sector work, a long operating history and a stock that has already delivered strong multi year returns. The real test for investors is whether that mix still looks attractively priced today.
Price-to-earnings of 12.7x for Peab: Is it justified?
Peab is currently trading on a P/E of 12.7x, and based on several valuation cross checks it is being treated as good value compared with peers and the wider construction sector.
The P/E ratio compares the SEK94.6 share price with the company’s earnings per share. For a construction and civil engineering group like Peab, this multiple gives a quick read on how the market is pricing its current profit level in relation to other listed businesses.
Peab screens as good value against several reference points. The stock’s 12.7x P/E is described as good value compared with the European Construction industry average of 15.6x and also versus a peer average of 19.6x. It is also framed as attractive when compared with an estimated fair P/E of 20x, which is a level the market could move toward if sentiment and earnings line up with those assumptions.
Explore the SWS fair ratio for Peab
Result: Price-to-earnings of 12.7x (UNDERVALUED)
However, you still need to weigh risks such as project execution issues or weaker profitability, which could challenge the current Peab valuation story.
Find out about the key risks to this Peab narrative.
Another view on Peab using the SWS DCF model
The P/E points to Peab looking cheap, but the SWS DCF model goes even further. With the share price at SEK94.6 and an estimated future cash flow value of SEK166.95, the stock is flagged as trading 43.3% below this fair value estimate. Which signal do you treat as more important?
Look into how the SWS DCF model arrives at its fair value.
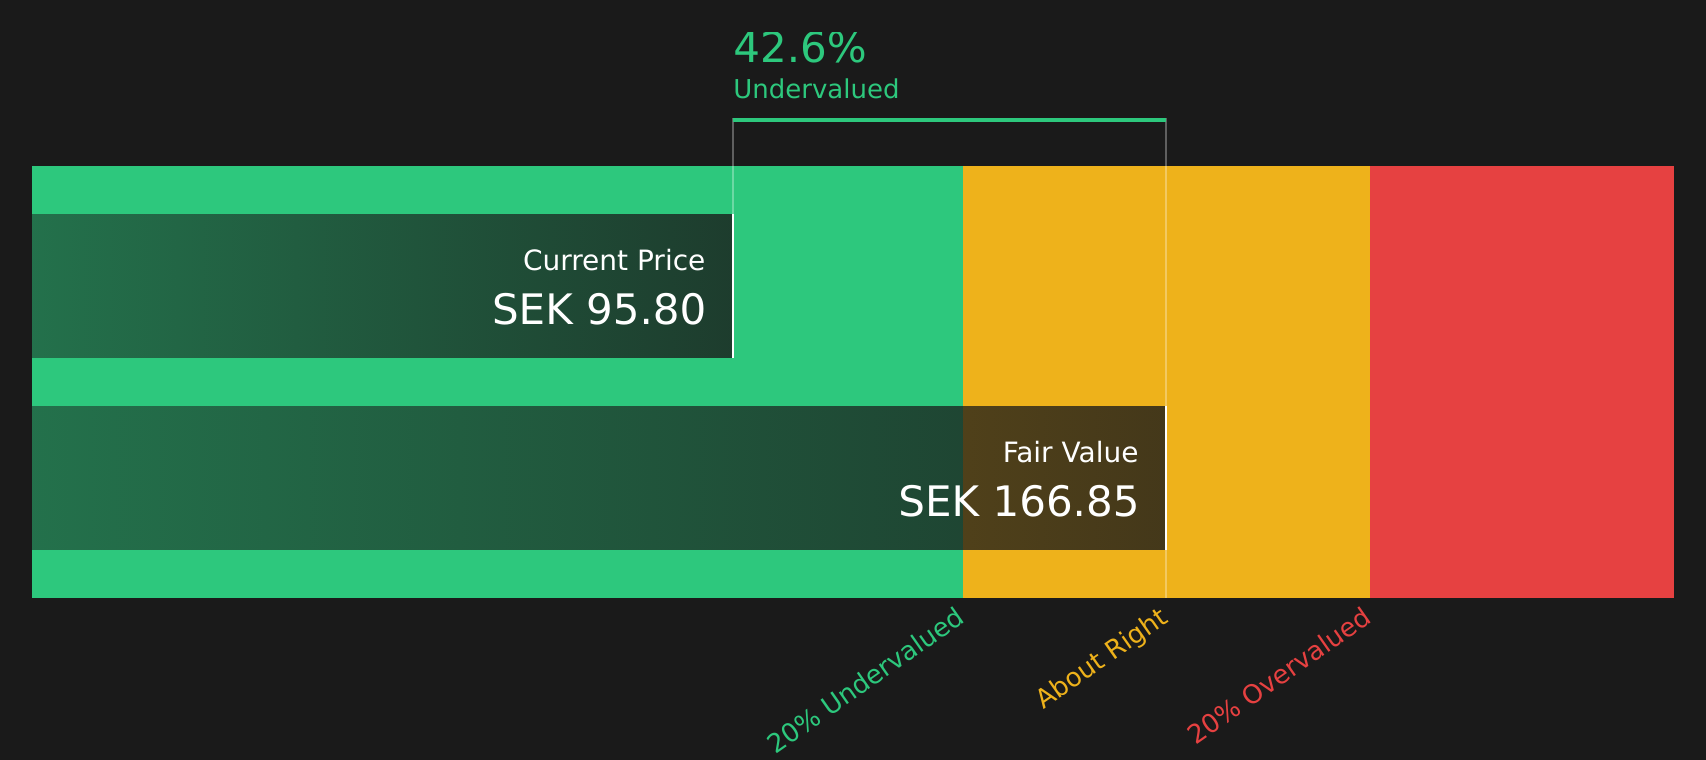
Simply Wall St performs a discounted cash flow (DCF) on every stock in the world every day (check out Peab for example). We show the entire calculation in full. You can track the result in your watchlist or portfolio and be alerted when this changes, or use our stock screener to discover 248 high quality undervalued stocks. If you save a screener we even alert you when new companies match - so you never miss a potential opportunity.
Next Steps
If the mix of valuation signals on Peab feels mixed, it makes sense to check the underlying data yourself and move quickly while the market is forming its view. To see both sides of the story in one place, take a close look at the 3 key rewards and 2 important warning signs
Looking for more investment ideas beyond Peab?
If you are serious about building a stronger portfolio, do not stop with Peab. Use targeted stock ideas to spot opportunities before everyone else does.
- Target potential mispricing by reviewing companies that screen as attractively valued on earnings and fundamentals through the 248 high quality undervalued stocks.
- Strengthen your income stream by focusing on companies that feature reliable payouts using the 438 dividend fortresses.
- Prioritise resilience by checking companies that score well on financial robustness with the 298 resilient stocks with low risk scores.
This article by Simply Wall St is general in nature. We provide commentary based on historical data and analyst forecasts only using an unbiased methodology and our articles are not intended to be financial advice. It does not constitute a recommendation to buy or sell any stock, and does not take account of your objectives, or your financial situation. We aim to bring you long-term focused analysis driven by fundamental data. Note that our analysis may not factor in the latest price-sensitive company announcements or qualitative material. Simply Wall St has no position in any stocks mentioned.
Have feedback on this article? Concerned about the content? Get in touch with us directly. Alternatively, email editorial-team@simplywallst.com