
- PRICING
- LIVE QUOTES
- LEARN
- HELP


EN
Passenger Transport Branch: National passenger car retail sales of 317,000 vehicles fell 22% year on year from August 1 to 9
The Zhitong Finance App learned that on August 1-9, the passenger car market retailed 317,000 vehicles, down 22% from the same period in August last year, down 3% from the same period last month. Since August 1-9, 10.49 million vehicles have been sold, down 20% year on year; from August 1 to 9, passenger car manufacturers across the country sold 276,000 vehicles, down 24% from the same period last month, up 2% from the same period last month. Since this year, 15.086 million vehicles have been sold, down 5% year on year.
In terms of new energy, from August 1 to 9, the national passenger car NEV market retailed 195,000 vehicles, down 17% from the same period last month, down 4% from the same period last month, and cumulative retail sales of 5.864 million units since this year, down 13% year on year; from August 1 to 9, passenger car manufacturers across the country sold 195,000 new energy vehicles, down 5% from the same period last month, and a total of 8.443 million vehicles have been sold since this year, up 7% year on year.
In terms of penetration rate, on August 1-9, the penetration rate of NEV retail sales in the national passenger car market was 61.6%; on August 1-9, the NEV wholesale penetration rate of passenger car manufacturers nationwide was 70.9%.
1. Retail sales trend in the national passenger car market in August 2026
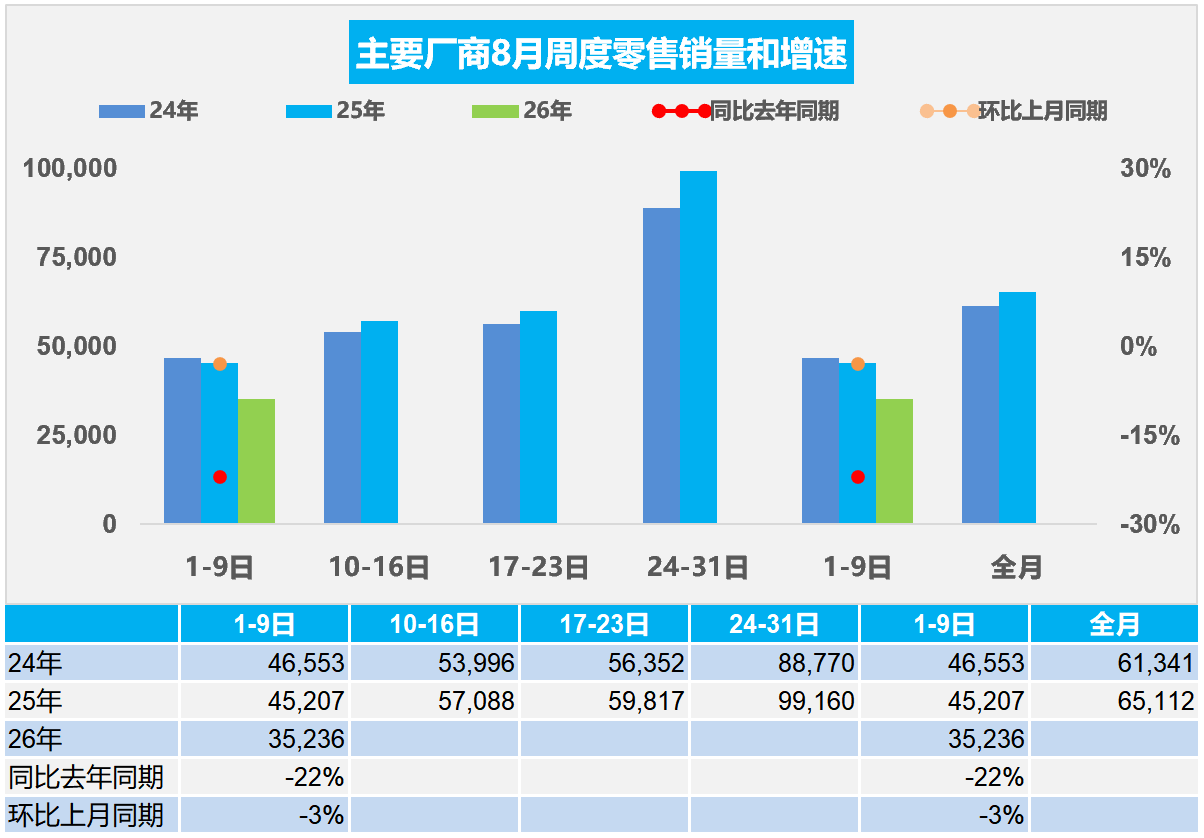
In the first week of August, the national passenger car market sold an average of 35,000 vehicles per day, down 22% from the same period in August last year and 3% from the same period last month.
From August 1 to 9, the national passenger car market retailed 317,000 vehicles, down 22% from the same period last year and 3% from the same period last month; since this year, 10.49 million vehicles have been sold, down 20% from the previous year.
Recently, the terminal market has been recovering at a steady pace, and the intertwining of multiple macro and industry factors has shaped a stable pattern of low market levels. Affected by the blockage of navigation in the Strait of Hormuz, international oil prices fluctuated upward in July. Domestic refined oil prices rose by a total of nearly 985 yuan/ton in two rounds, drastically increasing fuel vehicle and vehicle maintenance costs, continuing to suppress users' willingness to buy fuel vehicles, and demand for traditional fuel vehicles continued to weaken. Recently, the price of new energy vehicles has been stable, and there is a strong wait-and-see mentality among consumers. However, with the beginning of the school season in mid-late August, there will be a marked improvement in car purchase consumption. Although there are few new products for small electric vehicles, market demand is strong. Coupled with abundant funds for trade-in subsidies, target pressure is gradually increasing, and local policies are gradually relaxed, which is expected to drive the car market to improve faster.
In August, the car market was at the bottom of the recovery phase. With the gradual implementation of various policies to stabilize consumption and the gradual improvement of the superposition base, the decline in the passenger car market will gradually narrow, and the industry will officially enter a mature stage of value-driven and structural optimization, paving the way for the traditional “gold nine silver ten” market.
2. Wholesale sales trend of 8 national passenger car manufacturers in 2026
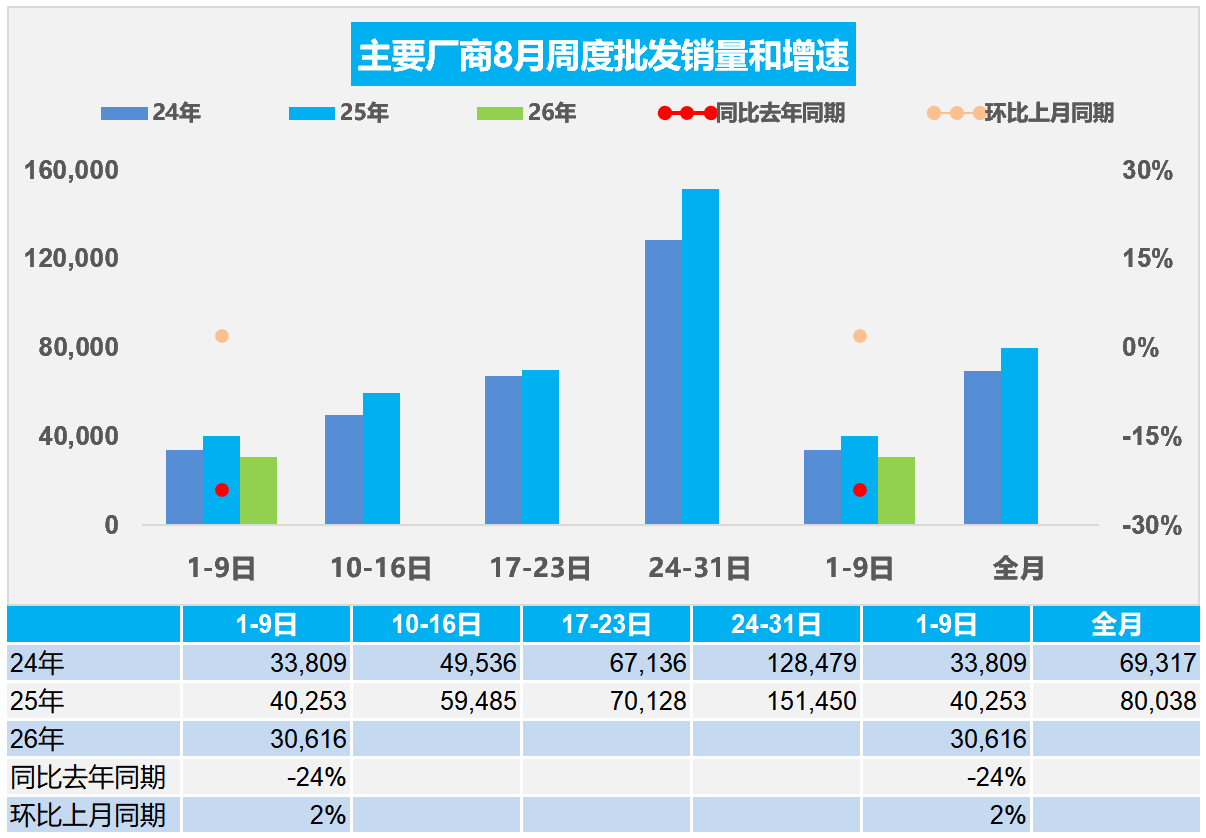
In the first week of August, passenger car manufacturers across the country sold an average of 31,000 vehicles per day, down 24% from the same period in August last year, and up 2% from the same period last month.
From August 1 to 9, passenger car manufacturers across the country wholesale 276,000 vehicles, down 24% from the same period in August last year, and up 2% from the same period last month; a total of 15.086 million units have been sold since this year, down 5% from the previous year.
The latest macroeconomic data shows that domestic consumption and manufacturing are weak, which directly constrains the recovery of the car market. In July, CPI rose 0.5% year on year and fell slightly by 0.1% month on month. The year-on-year increase was significantly down 0.5 percentage points from the previous month, reflecting insufficient domestic demand momentum; PPI rose 3.5% year on year, down 0.7% month on month, and upstream costs were marginally mitigated but transmission was lagging; PMI fell to 49.2%, and manufacturing sentiment declined, compounded by cautious consumer confidence and strong wait-and-see sentiment in the automobile market.
Due to the recent high market pressure, major manufacturers had many high temperature vacations in early August. The fuel vehicle market was hot last year, and this year it was greatly impacted by high fuel prices. At the beginning of the month, fuel vehicle shipments from manufacturers were slow, so it was temporarily low at the beginning of the month.
The national passenger car market bottomed out and stabilized in July
According to Passenger Link data, production side: 2.22,000 passenger cars were produced in July, down 1.6% year on year and 4.9% month on month. In July, luxury brand production fell 21% year on year and 12% month on month; joint venture brand production fell 35% year on year, down 24% month on month; independent brand production increased 12% year on year, up 0.1% month on month.
Wholesale side: In July, passenger car manufacturers across the country sold 2.252 million vehicles, down 0.2% year on year and 4.5% month on month; encouraged by the surge in exports, the year-on-year growth rate of passenger car wholesale in July was 20.7 percentage points higher than the retail growth rate. In July, autonomous car companies wholesale 1.733 million vehicles, up 9% year on year and down 3% month on month. Mainstream joint ventures wholesale 315,000 vehicles, down 30% year on year and 14% month on month. The wholesale volume of luxury cars was 204,000 units, down 5% year on year and 3% month on month.
Retail: In July 2026, the national passenger car market retailed 1.46 million vehicles, down 21% year on year and 9% month on month; since this year, 10.161 million vehicles have been sold, down 20% year on year. In July 2026, the domestic passenger car market showed a trend of continuous total pressure, month-on-month weakening, and extreme structural differentiation. The downturn in the off-season was highlighted, and the structural adjustment of the industry was further deepened.
Export side: In July, passenger car exports (including complete vehicles and CKD) were 918,000 units, up 87.8% year on year and 4.9% month on month, accounting for 41% of passenger car manufacturer sales (37% in the previous month, 21% in the same period in 2025). In July, new energy vehicles accounted for 58.8% of total exports, an increase of 14 percentage points over the same period. In July, exports of independent brands reached 775,000 vehicles, up 87% year on year; joint ventures and luxury brands exported 143,000 vehicles, up 108% year on year.
Inventory: Due to the manufacturer's extremely cautious production schedule in July, the manufacturer's wholesale production was higher than 30,000 units, while the manufacturer's monthly domestic wholesale was lower than the domestic retail price of 127,000 units. The characteristics of inventory removal were prominent this year. The overall inventory of the passenger car industry fell by 640,000 units in January-July (250,000 units in the same period in 2025, 600,000 units in the same period in 2024, and 180,000 units in the same period in 2023).
New energy dimension: Production of new energy passenger vehicles reached 1.449 million units in July, up 25.6% year on year and 0.2% month on month. In January-July, the cumulative production of new energy passenger vehicles reached 8.214,000 units, an increase of 7.9% over the previous year. Wholesale sales of new energy passenger vehicles reached 1.446 million units in July, up 21.3% year on year and down 2.8% month on month; in January-July, wholesale sales of new energy passenger vehicles reached 8.248 million units, up 7.6% year on year. Wholesale sales of conventional fuel passenger cars reached 810,000 units in July, down 24% year on year and 8% month on month. In July, the NEV passenger car market retailed 951,000 vehicles, down 3.9% year on year and 5.8% month on month; in January-July, the NEV passenger car market retailed 5.668 million vehicles, down 12.5% year on year. In July, 510,000 conventional fuel passenger cars were retailed, down 41% year on year and 14.2% month on month; among them, ordinary hybrid models fell only 4% year on year and 5% month on month. In July, NEV manufacturers exported 540,000 vehicles, up 147.8% year on year, up 8.1% month on month; in January-July, NEV manufacturers exported 2.771 million vehicles, up 128.5% year on year, and 379,000 conventional fuel passenger vehicles in July, up 42% year on year and 1% month on month.
In April July, China exported 1.09 million vehicles
From January to July 2026, 6.4 million vehicles were exported, a year-on-year increase of 54%, far exceeding the same period in previous years. Among them, 1.092,000 vehicles were exported in July, a year-on-year growth rate of 57%, a slight increase of 2% over the previous month, and the explosive growth was outstanding. From January to July 2026, total automobile exports reached US$11.8 billion, a sharp increase of 55% over the previous year, and the growth rate returned to a high level. Automobile exports in July were US$19 billion, up 60% year on year and 4% month-on-month, breaking the rule of July 2023-2025, which was slightly lower than May.
Total parts exports from January to July 2026 were US$60.7 billion, up 8% year on year. The growth rate rebounded slightly from the first half of 2025. Auto parts exports in July were 9.38 billion US dollars in a single month, up 14% year on year and down 4% month on month. After high growth in June, the trend was stable in July.
Auto parts exports grew steadily at the same time this year, focusing on serving mature markets in Europe and the US. Relying on a perfect supply chain system, they provided stable support for global car companies, forming a cross-complementary pattern where “parts are deeply cultivated in Europe and America, and vehicles spread globally”. The synergy effect of the industrial chain is prominent, and jointly supports the continuous improvement of the global competitiveness of the Chinese automobile industry.
5. Data tracking of China's automobile exports to overseas independent brands from January to June 2026
Since 2021, with the outbreak of COVID-19 in the world, the advantages of the resilience of China's automobile industry chain have been fully reflected, and the Chinese automobile export market has shown strong growth in the past two years. Chinese autonomous car companies are characterized by strong sales in some overseas regions. In 2025, China's autonomous vehicle companies sold 3.54 million vehicles locally in some regions that can be continuously counted overseas, up 28% year on year; in June 2026, the sales volume of their own brands in the Chinese overseas market was 490,000 units, up 69% year on year; in January-June, the sales volume of independent brands in the Chinese overseas market was 2.46 million units, up 62% year on year. The retail performance of China's independent overseas statisticable markets was very good.
Our overall autonomous vehicle sales share in overseas markets from January to June 2026 was 7.3%, an increase of 2.3 percentage points over the previous year. The sales volume of autonomous vehicles varies greatly around the world, with 20% in the southern hemisphere, 11% in Europe, and around 8% in Southeast Asia and the Middle East. The share of mainstream regions has reached about 10%, but exports to the US, Japan, and South Korea are still very cautious.
From January to June 2026, the overseas sales share of autonomous new energy passenger vehicles was 24%, up 10 percentage points from the same period in 2025. The main contributor to growth is the EU market.
Due to lessons learned from the experience of Chinese home appliances and other industries going overseas, the strategies for automobiles to go overseas are becoming more and more clear and perfect. From KD assembly to localized production and overseas mergers and acquisitions, the results of automobile companies' overseas strategies are outstanding. At present, China's own brand exports have entered a new stage in the strategy of strengthening bases to build rural encircled cities in guerrilla zones. Overseas, independent brands started with the construction of KD assembly and gradually increased the construction of a localized industrial chain. With automakers as the lead, the results of parts and vehicles going overseas in groups were remarkable. SAIC Motor, Geely, Great Wall, Chery, etc. have achieved great success. Autonomous vehicle exports have basically completely switched from a buyout model to a distribution model. Autonomous vehicle brands such as BYD, Great Wall, and Chery build overseas localized business control centers to comprehensively monitor the system capabilities of local sales and service outlets, and the reputation of independent brands in the local market is getting better and better.