
- PRICING
- LIVE QUOTES
- LEARN
- HELP


EN
NextVision Stabilized Systems (TASE:NXSN) Back In Focus After Record Results And Raised Outlook
Why NextVision Stabilized Systems Stock Is Back in Focus
NextVision Stabilized Systems (TASE:NXSN) is drawing fresh attention after record second quarter 2026 results and a higher full year revenue target of US$355 million, which is the second guidance increase this year.
The latest report shows second quarter sales of US$88.15 million and net income of US$53.65 million, with management pointing to strong demand, expanded production capacity, and ongoing investment plans as key drivers behind the raised outlook.
See our latest analysis for NextVision Stabilized Systems.
Despite the strong second quarter news flow and raised 2026 guidance, NextVision Stabilized Systems’ recent momentum has cooled. The share price is down 10.11% over the past 30 days and 24.73% over 90 days, even as the 1 year total shareholder return stands at 79.74% and the 5 year total shareholder return is very large.
If you are comparing NextVision’s recent move with other opportunities in the market, this can be a good moment to broaden your search and check out 39 robotics and automation stocks.
NextVision Stabilized Systems now pairs strong recent results and higher 2026 guidance with a share price that has pulled back sharply. Does that setback tip the risk reward in favour of buyers, or has the easy upside already passed?
Price-to-Earnings of 43.7x: Is It Justified for NextVision Stabilized Systems?
On the latest figures, NextVision Stabilized Systems trades on a P/E of 43.7x, while the share price sits at ₪216.1. That raises an obvious question for investors comparing this stock to other options in the same sector.
The P/E ratio compares the current share price to the company’s earnings per share. For a business like NextVision Stabilized Systems, which reports earnings and operates in the electronic security devices space, P/E is often used as a quick way to see how much the market is paying for each unit of current earnings.
There are two contrasting signals in the data. On one hand, the stock is considered expensive against the broader Asian Electronic industry, where the average P/E is 30.3x. On the other hand, the current 43.7x P/E is described as good value when lined up against a peer group average of 45.5x and an estimated fair P/E of 70.6x. That fair ratio suggests room for the market’s view to move closer to a higher earnings multiple if current expectations prove accurate.
Explore the SWS fair ratio for NextVision Stabilized Systems
Result: Price-to-Earnings of 43.7x (ABOUT RIGHT)
However, the recent share price pullback, along with any change in demand for NextVision Stabilized Systems’ electronic security devices, could quickly challenge the current P/E-based optimism.
Find out about the key risks to this NextVision Stabilized Systems narrative.
Another View on NextVision Stabilized Systems’ Valuation
The P/E of 43.7x paints one picture for NextVision Stabilized Systems. The SWS DCF model offers a different angle. On this view, the current price of ₪216.1 sits above an estimated future cash flow value of ₪133.43, which points to the stock trading at a premium.
That gap suggests cash flow expectations already carry a lot of optimism. The question for you is whether the recent guidance and growth forecasts are enough to support that richer DCF view, or whether the premium leaves less room for error.
Look into how the SWS DCF model arrives at its fair value.
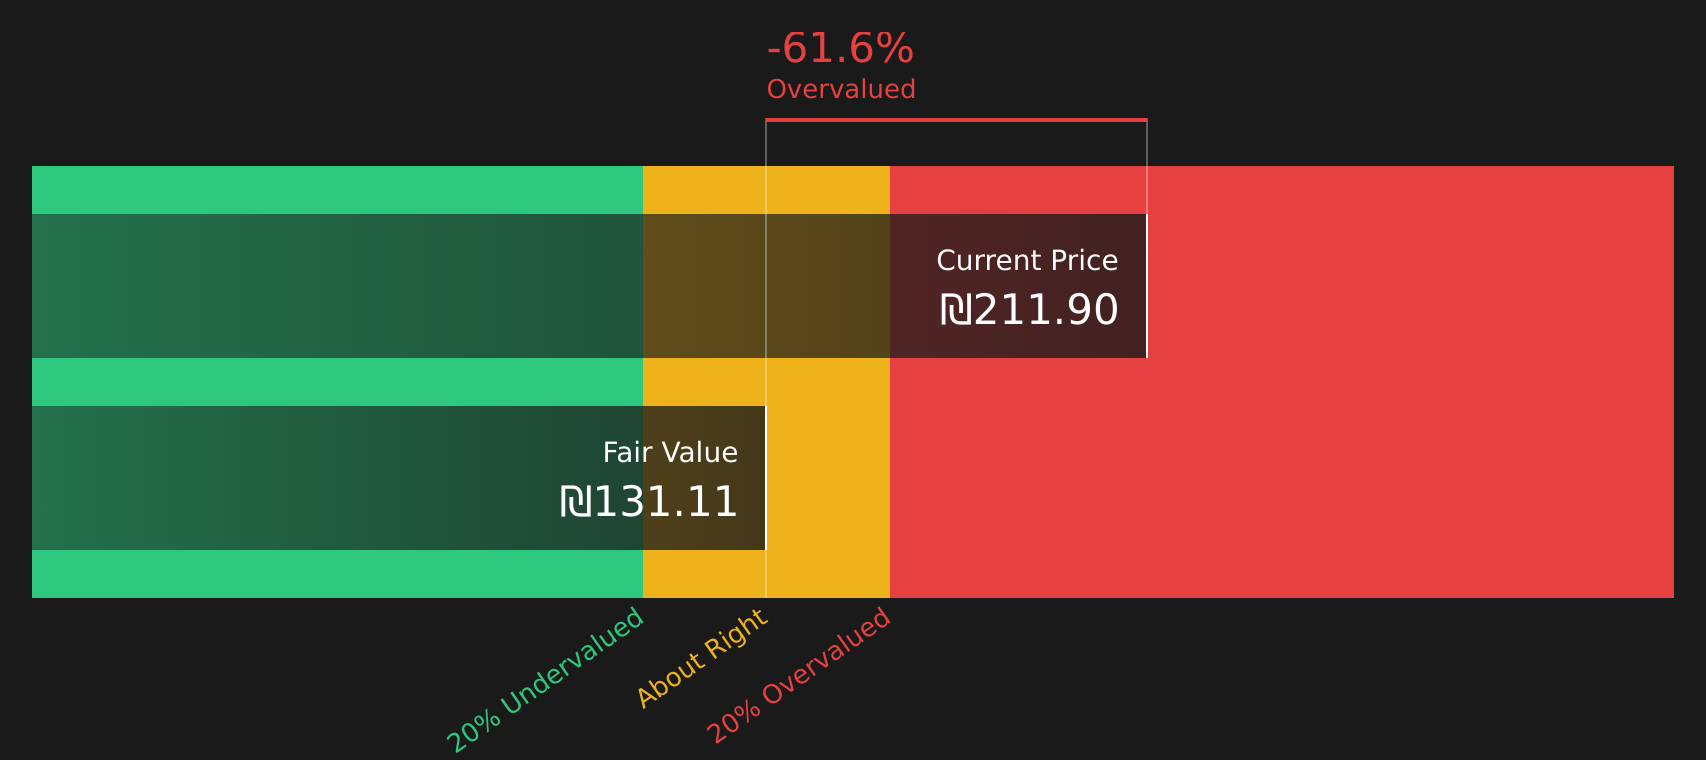
Simply Wall St performs a discounted cash flow (DCF) on every stock in the world every day (check out NextVision Stabilized Systems for example). We show the entire calculation in full. You can track the result in your watchlist or portfolio and be alerted when this changes, or use our stock screener to discover 258 high quality undervalued stocks. If you save a screener we even alert you when new companies match - so you never miss a potential opportunity.
Next Steps
With mixed signals around valuation and expectations for NextVision Stabilized Systems, it helps to look past the headlines and check the underlying data yourself. To weigh up both sides of the story, including the concerns and the potential upside, take a close look at these 2 key rewards and 2 important warning signs.
Looking for more investment ideas beyond NextVision Stabilized Systems?
If NextVision Stabilized Systems is on your radar, this is a good moment to widen your watchlist with a few more focused ideas from the Simply Wall Street screener.
- Spot potential value opportunities early by scanning screener containing 569 high quality undiscovered gems that combine strong fundamentals with lower market attention.
- Build a core list of quality names by focusing on companies in the solid balance sheet and fundamentals stocks screener (423 results) that may handle tougher conditions more comfortably.
- Prioritise capital protection by reviewing 296 resilient stocks with low risk scores that score well on resilience and volatility so fewer ideas slip past you.
This article by Simply Wall St is general in nature. We provide commentary based on historical data and analyst forecasts only using an unbiased methodology and our articles are not intended to be financial advice. It does not constitute a recommendation to buy or sell any stock, and does not take account of your objectives, or your financial situation. We aim to bring you long-term focused analysis driven by fundamental data. Note that our analysis may not factor in the latest price-sensitive company announcements or qualitative material. Simply Wall St has no position in any stocks mentioned.
Have feedback on this article? Concerned about the content? Get in touch with us directly. Alternatively, email editorial-team@simplywallst.com