
- PRICING
- LIVE QUOTES
- LEARN
- HELP


EN
Hubbell (HUBB) Reported Strong Sales Growth, Is The Stock Fully Valued?
What Hubbell’s latest earnings and guidance tell investors
Hubbell (HUBB) reported second quarter and six month 2026 results on July 28, alongside full year guidance for sales and GAAP diluted earnings per share that gives investors fresh data to assess the stock.
The company reported second quarter sales of US$1,711.8 million compared with US$1,484.3 million a year earlier, while net income was US$240.4 million compared with US$244.2 million. Diluted earnings per share from continuing operations were US$4.52 compared with US$4.56 in the prior year period.
See our latest analysis for Hubbell.
Hubbell’s latest guidance for 2026, alongside the earnings release on July 28, has arrived during a period of firm momentum, with a 12.22% year to date share price return and a 21.69% total shareholder return over the past year that extends a very large 5 year total shareholder return of 175.87%.
If you are looking beyond Hubbell for other grid and electrification beneficiaries, this is a useful moment to scan 37 power grid technology and infrastructure stocks
After Hubbell’s strong multi year run and the latest move higher, the share price now sits between a discounted analyst target and richer intrinsic estimates. Where does fair value appear to be anchored today?
Most Popular Narrative: 5.7% Undervalued
The most followed narrative currently places Hubbell’s fair value at $550.77 using a 10.07% discount rate, compared with the last close of $519.62. This frames the stock as modestly undervalued and anchors the latest price moves in a longer term earnings story.
Hubbell is implementing pricing and productivity actions to combat cost inflation from raw materials and tariffs, aiming for neutral impact in 2025. Successfully offsetting these costs is expected to stabilize earnings and improve net margins in the latter part of the year.
Want to see what sits underneath that earnings and margin path? The fair value hinges on a specific revenue glide path and a firmer profit profile. Curious how far profit per share needs to climb and what kind of multiple the market would need to accept to get there? The full narrative breaks down those moving parts and joins them into a single valuation story.
Result: Fair Value of $550.77 (UNDERVALUED)
Have a read of the narrative in full and understand what's behind the forecasts.
However, Hubbell’s story can change quickly if tariff related cost inflation bites into margins, or if weaker demand pulls grid automation and utility spending off course.
Find out about the key risks to this Hubbell narrative.
Another View on Hubbell’s valuation
The most popular narrative on Hubbell leans on earnings forecasts and a future P/E of around 31x to argue the stock is 5.7% undervalued against a fair value of $550.77. A different view comes from the SWS DCF model, which puts fair value at $385.65, below the current $519.62, and presents Hubbell as expensive on that cash flow basis. Which lens do you find more convincing?
Look into how the SWS DCF model arrives at its fair value.
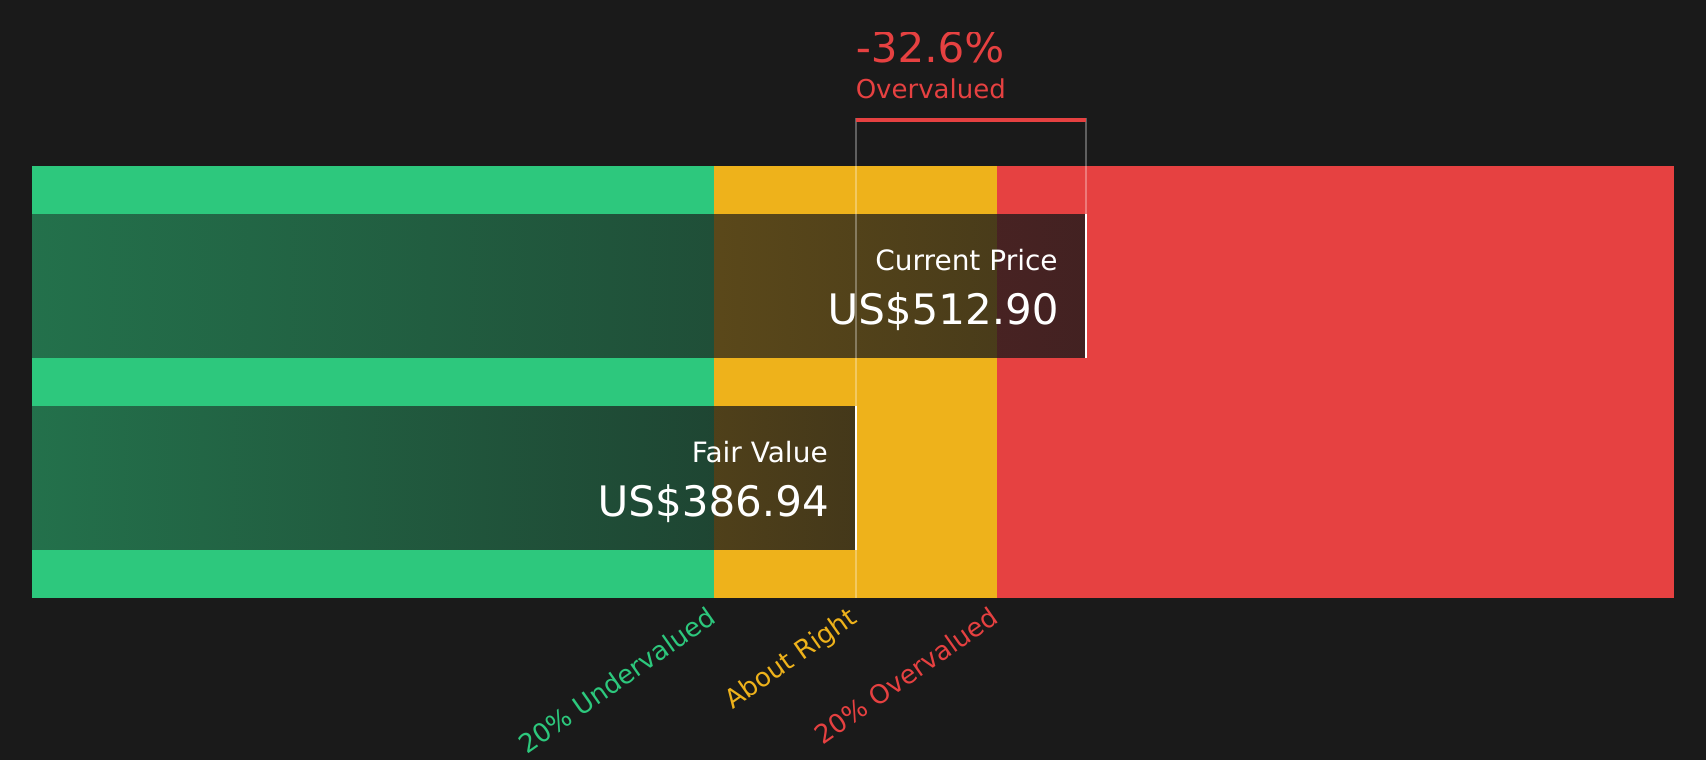
Simply Wall St performs a discounted cash flow (DCF) on every stock in the world every day (check out Hubbell for example). We show the entire calculation in full. You can track the result in your watchlist or portfolio and be alerted when this changes, or use our stock screener to discover 51 high quality undervalued stocks. If you save a screener we even alert you when new companies match - so you never miss a potential opportunity.
Next Steps
With both positives and concerns on the table for Hubbell, this is a good moment to move fast and review the underlying data yourself. To see how the balance of potential rewards and risks stacks up, take a closer look at the 3 key rewards and 1 important warning sign.
Looking for more investment ideas beyond Hubbell?
If Hubbell has your attention, use this momentum to widen your watchlist. Fresh ideas now can make a real difference to future portfolio decisions.
These hand picked sets of stocks from the Simply Wall Street Screener can help you quickly spot opportunities that fit different goals:
- Target quality at a discount by checking stocks that currently stand out on valuation using the 51 high quality undervalued stocks.
- Strengthen your income stream with companies that pay higher yields and focus on resilience through the 9 dividend fortresses.
- Prioritize stability and capital preservation by reviewing companies that appear more resilient on risk metrics via the 83 resilient stocks with low risk scores.
This article by Simply Wall St is general in nature. We provide commentary based on historical data and analyst forecasts only using an unbiased methodology and our articles are not intended to be financial advice. It does not constitute a recommendation to buy or sell any stock, and does not take account of your objectives, or your financial situation. We aim to bring you long-term focused analysis driven by fundamental data. Note that our analysis may not factor in the latest price-sensitive company announcements or qualitative material. Simply Wall St has no position in any stocks mentioned.
Have feedback on this article? Concerned about the content? Get in touch with us directly. Alternatively, email editorial-team@simplywallst.com