
- PRICING
- LIVE QUOTES
- LEARN
- HELP


EN
Tokyo Ohka Kogyo (TSE:4186) Could Be 49% Undervalued As Earnings Guidance Rises
Why Tokyo Ohka Kogyo Stock Is Back in Focus After Earnings
Tokyo Ohka Kogyo (TSE:4186) has come back on many investors’ radar after reporting half year sales of ¥139,668 million and net income of ¥20,409 million, alongside raised interim and full year guidance.
See our latest analysis for Tokyo Ohka Kogyo.
Despite the strong half year results and raised guidance, Tokyo Ohka Kogyo’s recent share price momentum has cooled, with the share price declining 12.93% over the past 30 days and 19.88% over 90 days. At the same time, the year to date share price return of 50.29% and 1 year total shareholder return of 103.24% still point to a powerful longer term upswing that has been shaped by changing expectations around growth linked to AI server demand and risk around how sustainable that performance may be.
If the AI driven story around Tokyo Ohka Kogyo has caught your attention, it can be useful to see what else is moving in that space and scan 56 AI infrastructure stocks
Tokyo Ohka Kogyo’s share price has cooled just as its earnings and guidance moved higher, which raises a simple question: Are investors already pricing in the AI server boom, or is sentiment running ahead of the business reality that recent numbers reflect?
Price-to-Earnings of 27x for Tokyo Ohka Kogyo: Is It Justified?
Tokyo Ohka Kogyo last closed at ¥9,025 and is flagged as expensive on a P/E of 27x compared with both peers and the wider JP Chemicals sector. That P/E sits alongside an internal fair value estimate that suggests the shares are trading at a 48.9% discount to an implied value, which gives investors two very different valuation signals to weigh up.
The P/E ratio compares the current share price to earnings per share. For a business like Tokyo Ohka Kogyo, which is focused on semiconductor related materials and equipment, a higher P/E can reflect the market paying up for earnings linked to areas such as AI server demand and advanced chip production.
In this case, the P/E of 27x is well ahead of the peer average of 19.1x and the JP Chemicals industry average of 12.7x. That suggests the market is attaching a premium to Tokyo Ohka Kogyo’s earnings relative to sector peers. At the same time, a fair P/E estimate of 20.4x indicates a level that the valuation could move toward if expectations and current pricing eventually align.
Explore the SWS fair ratio for Tokyo Ohka Kogyo
Result: Price-to-Earnings of 27x (OVERVALUED)
However, Tokyo Ohka Kogyo’s premium P/E and heavy AI server expectations could face pressure if semiconductor spending slows or if competitors gain share in key materials.
Find out about the key risks to this Tokyo Ohka Kogyo narrative.
Another View on Tokyo Ohka Kogyo’s Valuation
While the P/E of 27x makes Tokyo Ohka Kogyo look expensive against peers and the JP Chemicals sector, the SWS DCF model points the other way. On this view, the shares trade at a 48.9% discount to an estimated future cash flow value of ¥17,678.65.
This kind of gap between earnings based and cash flow based signals can cut both ways for investors who are weighing how much faith to place in AI driven growth assumptions versus what the cash flow model is implying about long term value.
Look into how the SWS DCF model arrives at its fair value.
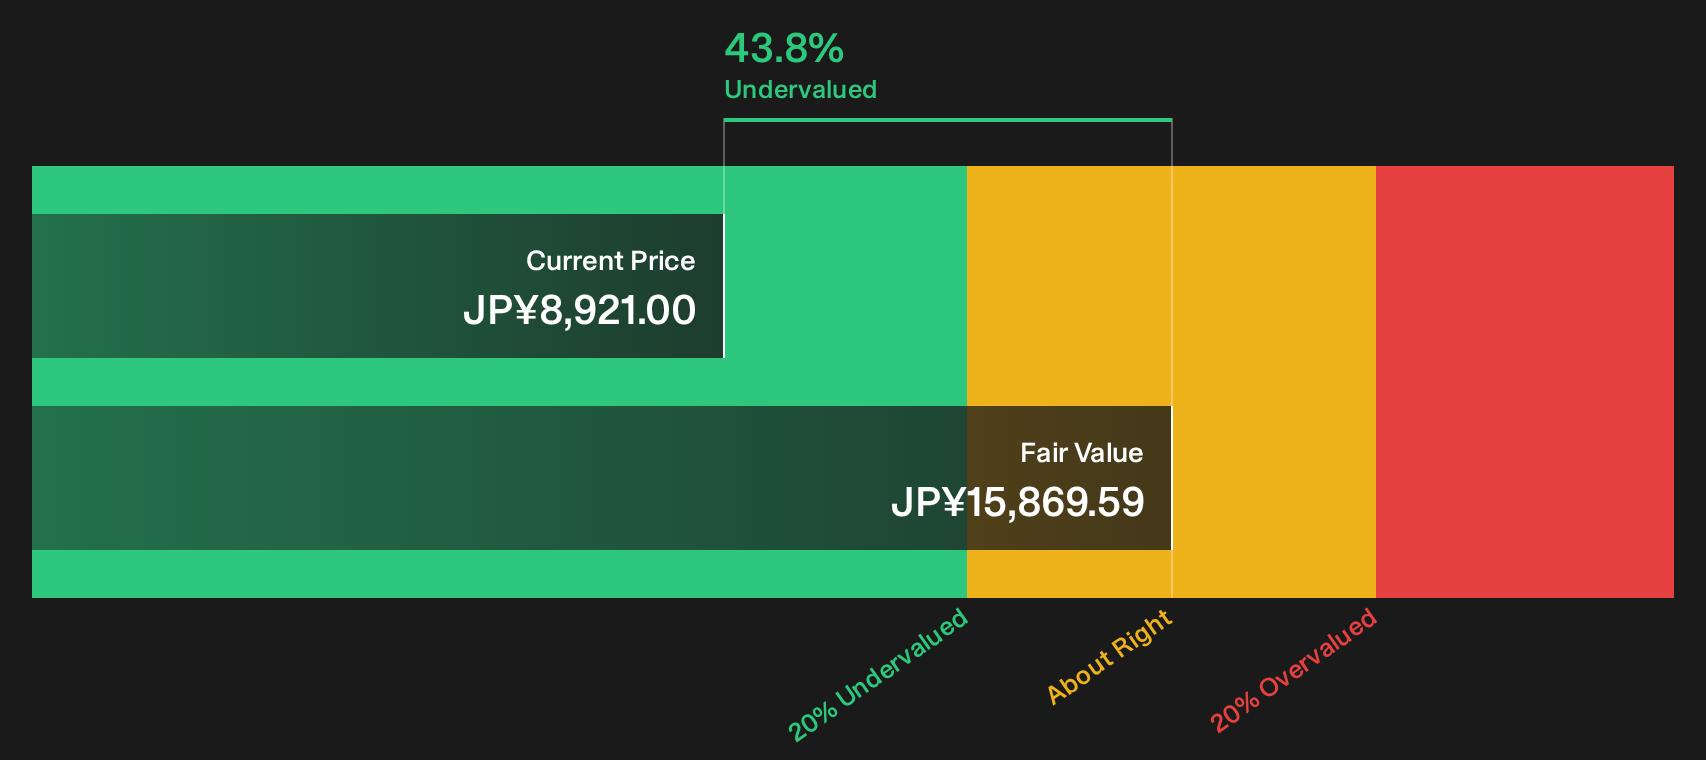
Simply Wall St performs a discounted cash flow (DCF) on every stock in the world every day (check out Tokyo Ohka Kogyo for example). We show the entire calculation in full. You can track the result in your watchlist or portfolio and be alerted when this changes, or use our stock screener to discover 19 high quality undervalued stocks. If you save a screener we even alert you when new companies match - so you never miss a potential opportunity.
Next Steps
If the mixed signals around Tokyo Ohka Kogyo leave you unsure, you can review the data in more detail and form your own view with the 3 key rewards and 1 important warning sign
Looking for more investment ideas beyond Tokyo Ohka Kogyo?
If Tokyo Ohka Kogyo has sharpened your interest in opportunities linked to clear data and fundamentals, it is worth widening your search with a few focused stock lists.
- Target strong value potential by checking companies that appear mispriced on key metrics through the 19 high quality undervalued stocks.
- Prioritise resilience and sleep a little easier at night by reviewing the 54 resilient stocks with low risk scores.
- Hunt for underfollowed opportunities that the crowd may have missed by scanning the screener containing 65 high quality undiscovered gems.
This article by Simply Wall St is general in nature. We provide commentary based on historical data and analyst forecasts only using an unbiased methodology and our articles are not intended to be financial advice. It does not constitute a recommendation to buy or sell any stock, and does not take account of your objectives, or your financial situation. We aim to bring you long-term focused analysis driven by fundamental data. Note that our analysis may not factor in the latest price-sensitive company announcements or qualitative material. Simply Wall St has no position in any stocks mentioned.
Have feedback on this article? Concerned about the content? Get in touch with us directly. Alternatively, email editorial-team@simplywallst.com