
- PRICING
- LIVE QUOTES
- LEARN
- HELP


EN
Yamazen (TSE:8051) Following Q1 Earnings Looks Pricey Next To Fair Value
How Yamazen’s latest earnings report set the tone for the stock
Yamazen (TSE:8051) released first quarter results on 10 August 2026, reporting sales of ¥145,862 million and net income of ¥1,913 million. Basic earnings per share from continuing operations was ¥21.57.
See our latest analysis for Yamazen.
Yamazen’s latest quarterly update has landed alongside strong recent momentum, with the 30-day share price return of 10.27% and year to date share price return of 27.26% feeding into a 1-year total shareholder return of 37.59%. This points to building optimism around the company and an evolving risk perception rather than short term trading alone.
If this earnings move has you thinking about where else capital goods and automation themes might lead, it could be a good time to look at 37 robotics and automation stocks.
Bulls point to Yamazen’s earnings and strong recent returns. Bears argue the move already reflects that progress. The next step is to see which side the valuation evidence supports.
Price-to-Earnings of 18.2x for Yamazen: Is it justified?
On the latest figures, Yamazen trades on a P/E of 18.2x against a last close of ¥1,900. That stands out against both its industry and closest peers, which raises a clear question for investors about what kind of earnings profile the market is pricing in at this level.
The P/E ratio compares the current share price with earnings per share. For a company like Yamazen, which operates across production equipment and consumer goods, this measure helps you see how much investors are currently prepared to pay for each unit of profit. A higher P/E often lines up with expectations of stronger or more resilient earnings, while a lower P/E can point to more cautious expectations.
In Yamazen’s case, earnings grew 18.9% over the past year and the company has high quality earnings, which can help explain a richer multiple compared with slower growing or less profitable peers. At the same time, management and board structures look reasonably robust, with an experienced management team and a board that balances new and seasoned directors. That governance backdrop can also support a higher valuation when investors weigh execution risk.
The comparison with the Trade Distributors industry is clear. Yamazen’s P/E of 18.2x sits well above the JP Trade Distributors industry average of 10.8x and above the peer average of 11.2x. That is a meaningful premium. It suggests the market is assigning Yamazen a higher price tag for each yen of earnings than is typical across its sector, and it would take continued profit delivery to keep that gap in place.
See what the numbers say about this price — find out in our valuation breakdown.
Result: Price-to-Earnings of 18.2x (OVERVALUED)
However, Yamazen’s premium P/E and heavy revenue concentration in Japan mean that any earnings disappointment or domestic slowdown could quickly challenge the current optimism.
Find out about the key risks to this Yamazen narrative.
Another view on Yamazen’s valuation
The P/E premium paints Yamazen as expensive, yet the SWS DCF model is even more cautious. It points to a future cash flow value of just ¥16.54 per share against a market price of ¥1,900, which implies the stock looks very overvalued on this lens. Which signal do you put more weight on?
Look into how the SWS DCF model arrives at its fair value.
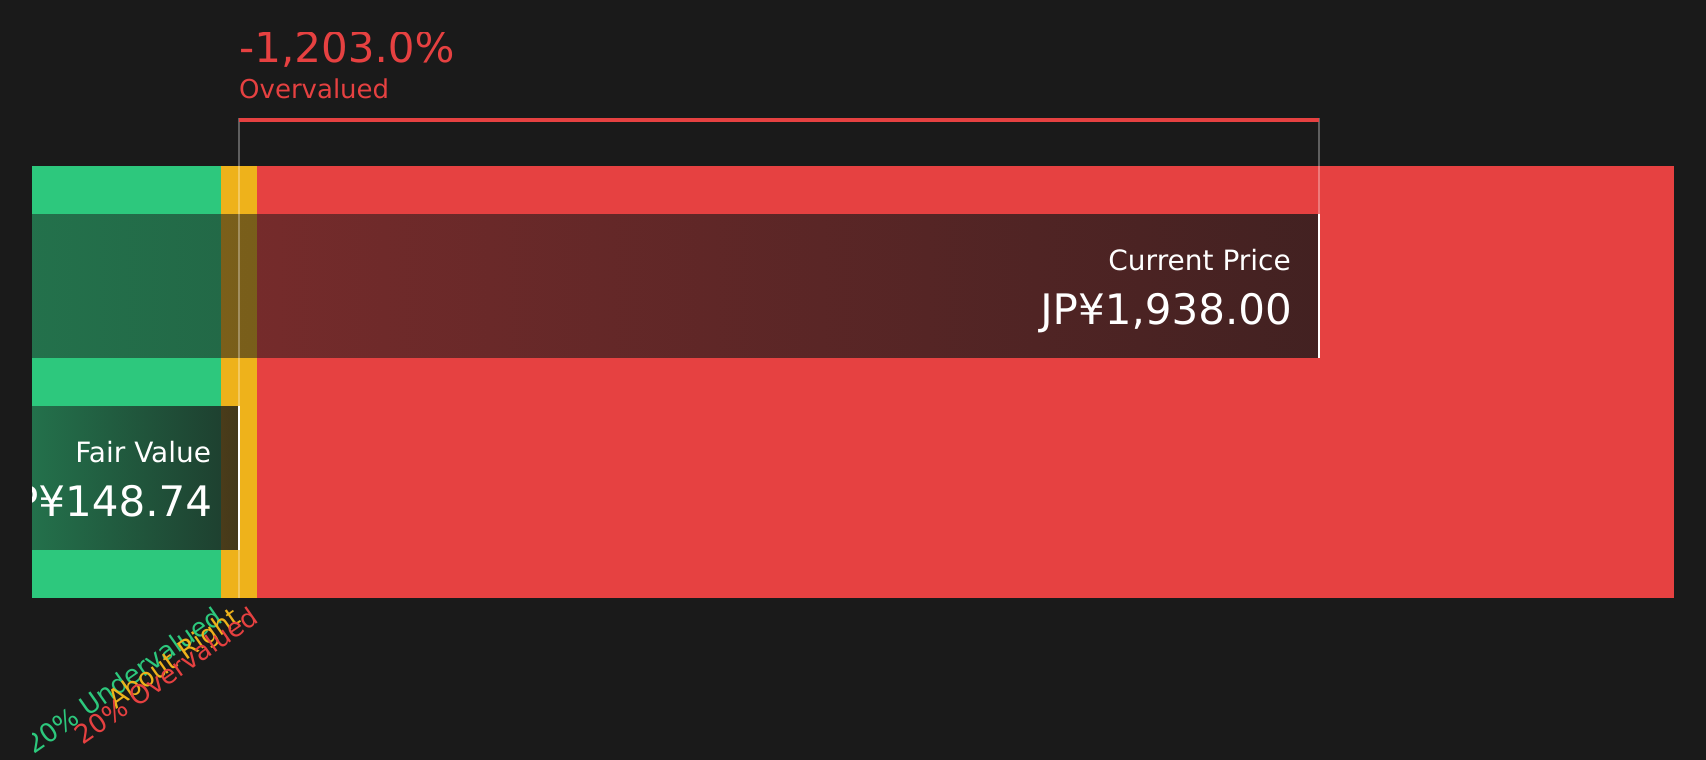
Simply Wall St performs a discounted cash flow (DCF) on every stock in the world every day (check out Yamazen for example). We show the entire calculation in full. You can track the result in your watchlist or portfolio and be alerted when this changes, or use our stock screener to discover 19 high quality undervalued stocks. If you save a screener we even alert you when new companies match - so you never miss a potential opportunity.
Next Steps
If the mixed signals on Yamazen leave you unsure, now is a good time to look at the numbers yourself and weigh both sides carefully. To see how the risks and potential rewards balance out, start with the 1 key reward and 2 important warning signs.
Looking for more ideas beyond Yamazen?
If Yamazen has sharpened your interest in fresh opportunities, this is a smart moment to widen the lens and see how other stocks stack up using focused screeners.
- Target value by scanning for quality companies trading on attractive metrics with the 19 high quality undervalued stocks.
- Strengthen your income focus by reviewing stocks that qualify as 39 dividend fortresses.
- Prioritise resilience by checking companies that pass the 54 resilient stocks with low risk scores before others spot them.
This article by Simply Wall St is general in nature. We provide commentary based on historical data and analyst forecasts only using an unbiased methodology and our articles are not intended to be financial advice. It does not constitute a recommendation to buy or sell any stock, and does not take account of your objectives, or your financial situation. We aim to bring you long-term focused analysis driven by fundamental data. Note that our analysis may not factor in the latest price-sensitive company announcements or qualitative material. Simply Wall St has no position in any stocks mentioned.
Have feedback on this article? Concerned about the content? Get in touch with us directly. Alternatively, email editorial-team@simplywallst.com