
- PRICING
- LIVE QUOTES
- LEARN
- HELP


EN
3 Reasons Itoham Yonekyu Holdings (TSE:2296) Valuation Is In Focus On New Guidance
How the new guidance and quarterly results frame Itoham Yonekyu Holdings stock
Itoham Yonekyu Holdings (TSE:2296) has just paired fresh full year and second quarter earnings guidance with its first quarter results. This provides new reference points for assessing the stock in August 2026.
The company now projects cumulative second quarter net sales of ¥510,000 million, operating profit of ¥13,800 million and profit attributable to owners of parent of ¥9,500 million, with profit per share at ¥167.40.
For the full fiscal year ending March 31, 2027, Itoham Yonekyu Holdings expects net sales of ¥1,040,000 million, operating profit of ¥27,000 million, profit attributable to owners of parent of ¥18,500 million and profit per share of ¥325.99.
Alongside this guidance, first quarter sales were ¥281,064 million compared with ¥297,110 million a year earlier. Net income was ¥6,129 million compared with ¥6,376 million, with basic earnings per share at ¥108.01 versus ¥112.39.
See our latest analysis for Itoham Yonekyu Holdings.
The latest guidance and first quarter update come as Itoham Yonekyu Holdings trades at ¥5,010, with a 30 day share price return of 3.94% but a year to date share price decline of 11.80%, while the 3 year total shareholder return stands at 52% and the 5 year total shareholder return at 64.34%. This suggests long term holders have seen meaningfully different outcomes from recent short term moves.
If these results have you rethinking where opportunities might sit, it could be a good time to widen your watchlist with 11 top founder-led companies
Given Itoham Yonekyu Holdings has pulled back year to date yet still carries solid multi year returns and fresh guidance, it is a fair moment to ask whether to add now or wait for a cheaper entry. Next comes valuation.
Preferred P/E of 14.2x for Itoham Yonekyu Holdings: Is it justified?
Itoham Yonekyu Holdings last closed at ¥5,010 and currently trades on a P/E of 14.2x, which sits below several reference points that investors often watch.
The P/E ratio compares the current share price with earnings per share. For a mature food producer like Itoham Yonekyu Holdings, it gives a quick sense of how the market prices each unit of earnings in a sector where growth is usually steady rather than rapid.
Here, the picture is that the stock trades on a lower P/E than the Japan Food industry average of 16.3x, below the peer average of 26.3x and also below an estimated fair P/E of 16.6x. That combination suggests the market is assigning a discount to current earnings even though the company is assessed as having high quality earnings and has recently grown earnings faster than the industry.
Compared with the wider food sector, these gaps are not small. A move toward the 16.6x fair P/E level or closer to peer averages would require a meaningful re rating of Itoham Yonekyu Holdings relative to today.
Explore the SWS fair ratio for Itoham Yonekyu Holdings.
Result: Price to earnings of 14.2x (UNDERVALUED)
However, Itoham Yonekyu Holdings still faces risks if earnings growth slows or if consumer demand weakens, which could keep the current P/E discount in place.
Find out about the key risks to this Itoham Yonekyu Holdings narrative.
Another View on Itoham Yonekyu Holdings using DCF
While the current P/E of 14.2x makes Itoham Yonekyu Holdings look attractively priced against industry and peer averages, the SWS DCF model points in the opposite direction. At ¥5,010 the stock sits above an estimated future cash flow value of ¥4,925.48, which suggests it may be slightly overvalued on this measure. That leaves a simple question for you: which signal matters more, earnings multiples or cash flows?
Look into how the SWS DCF model arrives at its fair value.
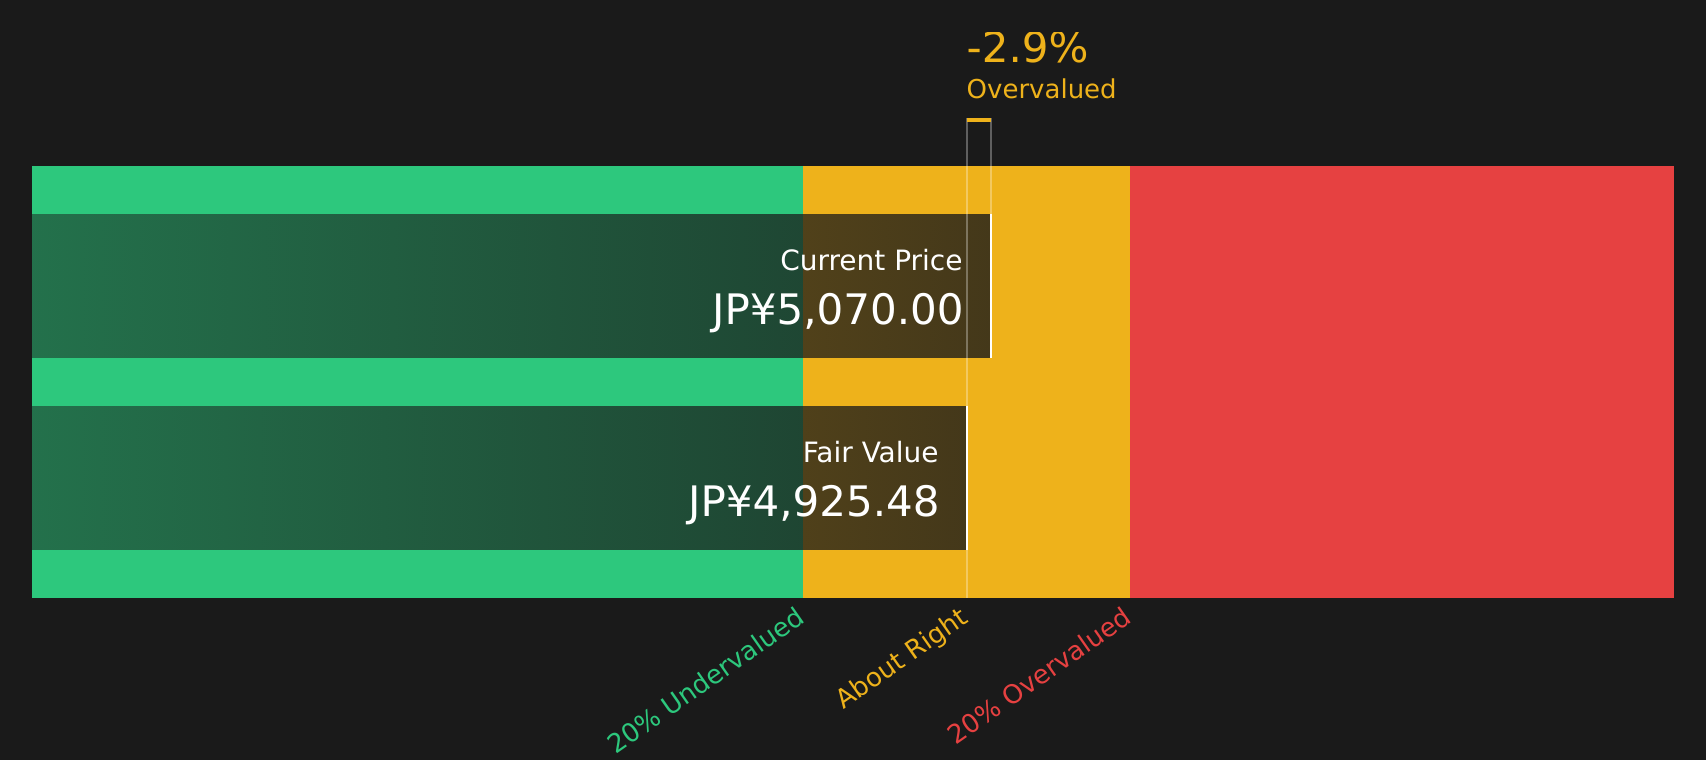
Simply Wall St performs a discounted cash flow (DCF) on every stock in the world every day (check out Itoham Yonekyu Holdings for example). We show the entire calculation in full. You can track the result in your watchlist or portfolio and be alerted when this changes, or use our stock screener to discover 19 high quality undervalued stocks. If you save a screener we even alert you when new companies match - so you never miss a potential opportunity.
Next Steps
If this mix of guidance, valuation signals and recent share price moves leaves you uncertain, take a closer look at the data now and shape your own view. To help, you can review a breakdown of both the potential upside and the key issues that investors are watching with 3 key rewards and 1 important warning sign
Looking for more investment ideas beyond Itoham Yonekyu Holdings?
If Itoham Yonekyu Holdings has sharpened your thinking, use this moment to scan wider opportunities and keep your portfolio ideas fresh and grounded in data.
- Target income resilience by reviewing companies in the 39 dividend fortresses that may help anchor your returns when markets feel choppy.
- Hunt for quality at a potential discount through the screener containing 65 high quality undiscovered gems, where strong fundamentals might not yet be fully reflected in prices.
- Prioritise capital preservation with the 55 resilient stocks with low risk scores, which highlights stocks assessed with more resilient risk profiles.
This article by Simply Wall St is general in nature. We provide commentary based on historical data and analyst forecasts only using an unbiased methodology and our articles are not intended to be financial advice. It does not constitute a recommendation to buy or sell any stock, and does not take account of your objectives, or your financial situation. We aim to bring you long-term focused analysis driven by fundamental data. Note that our analysis may not factor in the latest price-sensitive company announcements or qualitative material. Simply Wall St has no position in any stocks mentioned.
Have feedback on this article? Concerned about the content? Get in touch with us directly. Alternatively, email editorial-team@simplywallst.com