
- PRICING
- LIVE QUOTES
- LEARN
- HELP


EN
TURPAZ INDUSTRIES LTD. ANNOUNCES RECORD SECOND QUARTER AND FIRST HALF 2026 RESULTS
English Results Webinar Scheduled at 10am Eastern Time and 5pm Israel Time
CAESAREA, Israel, Aug. 11, 2026 /PRNewswire/ -- Turpaz Industries Ltd. (TASE: TRPZ), a global company that develops, manufactures, markets and sells thousands of flavor extracts, fragrance extracts and specialty fine ingredients to customers in more than 100 countries around the world, today announced record financial results for the second quarter and first half ended June 30, 2026, reflecting continued double-digit growth across all key financial metrics and the successful combination of organic growth with the Company's merger and acquisition strategy.
Financial Highlights
- First half revenues grew 40.5% to a record $173.9 million, with organic growth of 8.1% excluding currency effects;
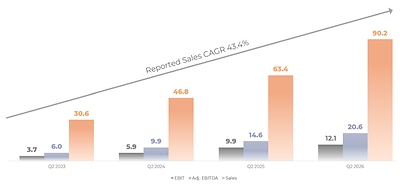
- Second quarter revenues grew 42.3% to a record $90.2 million, with organic growth of 7.3%;
- First half adjusted EBITDA increased 41.6% to $40.0 million; second quarter adjusted EBITDA increased 40.9% to $20.6 million;
- First half net income grew 80.9% to $19.2 million; second quarter net income grew 56.4% to $8.2 million;
- Current annual revenue run-rate of approximately $380 million, following the acquisitions completed in the U.S. and France.
Management Comment
Karen Cohen Khazon, Chief Executive Officer of Turpaz Industries, said, "Turpaz continues to deliver record results and double-digit growth, both in the second quarter and in the first half of 2026. These results reflect the continued successful execution of our growth strategy, which combines organic growth with strategic acquisitions, the integration of the acquired companies, the realization of synergies, cross-selling and the leveraging of Turpaz's global platform."
"The first half of 2026 demonstrated the successful integration of the companies we acquired during 2025. These acquisitions materially strengthened the Group's management, research, development, operational, marketing and sales infrastructure, as well as our geographic footprint. Together, they enable us to sustain accelerated growth through the combination of strategic acquisitions and organic growth."
"The double-digit increase across every operating metric demonstrates that Turpaz has a proven operating model – one that includes the rapid integration of acquired companies, cross-selling, and the leveraging of global platforms."
Second Quarter and First Half 2026 Summary
Turpaz Industries Group, a global company that develops, manufactures, markets and sells flavor extracts, fragrance extracts and specialty fine ingredients, today reported record results for the second quarter and first half of 2026. The results reflect continued double-digit growth across all key metrics, achieved through the successful combination of organic growth with the Group's merger and acquisition strategy.
First Half 2026 Results
Group revenues in the first half of 2026 grew by 40.5% to a record $173.9 million, compared with the corresponding period last year. The growth was driven by high organic growth of 8.1%, excluding currency effects, together with the contribution of the acquisitions completed during 2025 and in the first half of 2026.
As of the date of this report, Turpaz's revenues, together with the companies acquired in the U.S. and France, reflect an annual revenue run-rate of approximately $380 million, illustrating the step-change in the scale of the Group's global operations.
Gross profit in the first half grew by 50.2% to $72.5 million. Gross margin improved to 41.7%, compared with 39.0% in the corresponding period, driven by continued operational efficiency measures, the realization of synergies and growth in the business. Adjusted EBITDA increased by 41.6% to $40.0 million, representing 23.0% of revenues, compared with $28.3 million, or 22.8% of revenues, in the corresponding period.
Operating profit grew by 27.7% to $25.0 million, and net income grew by 80.9% to $19.2 million. The increase in net income was driven primarily by profitable growth, the acquisitions completed during the period and the synergies generated from them, as well as non-cash financing income relating to the early acquisition of the sellers' full holdings in FIT.
Second Quarter 2026 Results
Group revenues in the second quarter of 2026 grew by 42.3% to a record $90.2 million. Revenue growth included organic growth of 7.3%, above the industry rate, alongside the contribution of the companies whose acquisitions were completed. Gross profit grew by 51.5% to $37.4 million, representing 41.5% of revenues, and adjusted EBITDA increased by 40.9% to $20.6 million, representing 22.9% of revenues. Operating profit grew by 22.0% to $12.1 million, and net income grew by 56.4% to $8.2 million.
Continued Execution of the Growth Strategy
Since the beginning of 2025, Turpaz has completed eight strategic transactions, including the acquisition of Phoenix in the U.S. and the acquisition of Romessence in France during the second quarter of 2026. Turpaz identified at an early stage the trends shaping the industry and the strengthening of the fragrance segment. Accordingly, over the past year the Company deepened its activity through strategic acquisitions in the U.S. and in Grasse, France – the global center of perfumery – and established a broad global platform that enables it to benefit from the industry's growth trends. The acquisitions significantly expanded the Group's operations in North America and Europe, deepened its activity in fine fragrance, strengthened its development, manufacturing and marketing capabilities, and created significant potential for synergies and for continued improvement in profitability.
The Company continues to present a particularly strong capital structure, positive cash flow and good access to sources of financing, which support the Group's acquisition strategy. The Company had cash balances of approximately $50.9 million and continues to generate cash flow from operating activities. A net debt to adjusted EBITDA ratio of 1.8 reflects a balanced level of leverage that allows the Company to continue evaluating acquisition opportunities while maintaining financial discipline. Total equity of $315.5 million provides a solid financial base for the continued expansion of the Company's activities.
English Results Webinar
The Company will be hosting a webinar later today via Zoom, starting at 10am Eastern Time and 5pm Israel Time. On the call, Ms. Karen Cohen Khazon, Chief Executive Officer, and Mr. Guy Gill, Executive Vice President and Chief Financial Officer, will review and present the results and will be available to answer investor questions.
To participate in the Zoom webinar, please register at the following link:
https://us06web.zoom.us/webinar/register/WN_C1g9OShaSvSCY1-2tikv5w
Following registration, investors will be sent the link to the webinar which is accessible either via the Zoom app, or alternatively from a dial-in telephone number. If you have an issue with registration, please contact the Turpaz investor relations team, well in advance of the webinar.
For those unable to participate, the call will be available for replay through the same link, or from a link to the recording on the Turpaz investor relations website, the day following the webinar.
About Turpaz Industries Ltd.
Turpaz Industries Group is a global company operating in the fields of flavor extracts, fragrance extracts and specialty fine ingredients. The Group develops, manufactures, markets and sells thousands of products to more than 4,900 customers in over 100 countries around the world. Turpaz operates 30 manufacturing sites, research and development centers, laboratories and sales, marketing and regulatory offices worldwide, and employs more than 1,100 people. Since 2017, the Company has completed 28 acquisitions worldwide, which have expanded its geographic footprint, strengthened its development and manufacturing capabilities and broadened the range of products and solutions offered to its customers. The Company's business strategy is based on organic growth at a rate higher than market growth, and the successful and systematic implementation of strategic acquisitions.
For more information, please visit Turpaz's website, at: https://www.turpaz.co.il/Investors
International Investor Relations
Ehud Helft
EK Global Investor Relations
turpaz@ekgir.com
(US) +1 212 378 8040
CONSOLIDATED STATEMENTS OF FINANCIAL POSITION |
||||||
June 30, |
December 31, |
|||||
2026 |
2025 |
2025 |
||||
Unaudited |
Audited |
|||||
U.S. dollars in thousands |
||||||
ASSETS |
||||||
CURRENT ASSETS: |
||||||
Cash and cash equivalents |
50,889 |
31,003 |
143,095 |
|||
Trade receivables |
69,289 |
48,618 |
51,262 |
|||
Other accounts receivable |
7,227 |
6,103 |
7,317 |
|||
Inventories |
72,039 |
48,503 |
55,021 |
|||
Financial assets |
1,127 |
- |
1,054 |
|||
200,571 |
134,227 |
257,749 |
||||
NON-CURRENT ASSETS: |
||||||
Deferred taxes |
3,745 |
2,271 |
2,913 |
|||
Property, plant and equipment, net |
77,022 |
62,378 |
70,756 |
|||
Right-of-use assets, net |
39,345 |
20,798 |
24,813 |
|||
Intangible assets, net |
456,985 |
268,848 |
332,522 |
|||
Investment in companies accounted for at equity |
25,319 |
25,664 |
25,181 |
|||
Financial assets |
- |
980 |
- |
|||
602,416 |
380,939 |
456,185 |
||||
802,987 |
515,166 |
713,934 |
||||
CONSOLIDATED STATEMENTS OF FINANCIAL POSITION |
||||||
June 30, |
December 31, |
|||||
2026 |
2025 |
2025 |
||||
Unaudited |
Audited |
|||||
U.S. dollars in thousands |
||||||
LIABILITIES AND EQUITY |
||||||
CURRENT LIABILITIES: |
||||||
Credit from banks and current maturities of long- term loans from banks and others |
66,636 |
57,388 |
51,951 |
|||
Trade payables |
37,685 |
23,621 |
24,843 |
|||
Other accounts payable |
22,854 |
17,150 |
21,202 |
|||
Short-term liabilities in respect of acquisition of activity |
92,594 |
8,062 |
12,388 |
|||
Current maturities of lease liabilities |
5,349 |
3,491 |
4,089 |
|||
225,118 |
109,712 |
114,473 |
||||
NON-CURRENT LIABILITIES: |
||||||
Long-term loans from banks, less current maturities |
134,149 |
94,672 |
127,344 |
|||
Long-term loans from others, less current maturities |
- |
216 |
- |
|||
Provision for waste removal |
1,198 |
1,190 |
1,176 |
|||
Long-term leases liabilities |
35,568 |
18,556 |
22,211 |
|||
Long-term liabilities in respect of acquisition of activity |
61,718 |
108,025 |
134,530 |
|||
Deferred taxes |
28,605 |
14,436 |
19,913 |
|||
Employee benefit liabilities |
1,127 |
516 |
848 |
|||
262,365 |
237,611 |
306,022 |
||||
EQUITY: |
||||||
Equity attributable to equity holders of the company: |
||||||
Share capital (*) |
1 |
1 |
1 |
|||
Share premium |
186,975 |
78,304 |
177,521 |
|||
Other capital reserves |
(4,348) |
(6,384) |
(6,563) |
|||
Reserve in respect of translation differences |
14,469 |
(154) |
8,167 |
|||
Retained earnings |
80,092 |
61,498 |
70,658 |
|||
277,189 |
133,265 |
249,784 |
||||
Non-controlling interests |
38,315 |
34,578 |
43,655 |
|||
Total equity |
315,504 |
167,843 |
293,439 |
|||
802,987 |
515,166 |
713,934 |
||||
*) Less than $ 1 thousand. |
||||||
CONSOLIDATED STATEMENTS OF COMPREHENSIVE INCOME |
||||||||||
Six months ended June 30, |
Three months ended June 30, |
Year ended December 31, |
||||||||
2026 |
2025 |
2026 |
2025 |
2025 |
||||||
Unaudited |
Audited |
|||||||||
U.S. dollars in thousands (except per share data) |
||||||||||
Revenues from sales |
173,870 |
123,777 |
90,229 |
63,418 |
275,148 |
|||||
Cost of sales |
101,402 |
75,543 |
52,790 |
38,703 |
165,127 |
|||||
Gross profit |
72,468 |
48,234 |
37,439 |
24,715 |
110,021 |
|||||
Research and development expenses |
7,996 |
4,481 |
4,326 |
2,311 |
11,046 |
|||||
Selling and marketing expenses |
17,927 |
11,230 |
9,436 |
5,667 |
26,286 |
|||||
General and administrative expenses |
20,333 |
13,406 |
10,350 |
6,885 |
29,464 |
|||||
Company's share of earnings of companies accounted for at equity, net |
(722) |
(599) |
(235) |
(230) |
(764) |
|||||
Other expenses |
1,960 |
160 |
1,462 |
160 |
559 |
|||||
Operating income |
24,974 |
19,556 |
12,100 |
9,922 |
43,430 |
|||||
Finance expenses, net |
578 |
5,562 |
1,628 |
3,075 |
13,218 |
|||||
Income before taxes on income |
24,396 |
13,994 |
10,472 |
6,847 |
30,212 |
|||||
Taxes on income |
5,163 |
3,361 |
2,304 |
1,624 |
7,557 |
|||||
Net income |
19,233 |
10,633 |
8,168 |
5,223 |
22,655 |
|||||
Other comprehensive income (net of tax effect): |
||||||||||
Amounts that will not be reclassified subsequently to profit or loss: |
||||||||||
Adjustments arising from translating financial statements from functional currency to presentation currency |
21,561 |
8,872 |
19,512 |
14,755 |
27,649 |
|||||
Amounts that will be or that have been reclassified to profit or loss when specific conditions are met: |
||||||||||
Adjustments arising from translating financial statements of foreign operations |
(15,906) |
2,131 |
(11,587) |
(6,201) |
(8,079) |
|||||
Comprehensive income |
24,888 |
21,636 |
16,093 |
13,777 |
42,225 |
|||||
Net income attributable to: |
||||||||||
Equity holders of the Company |
16,234 |
8,558 |
6,727 |
4,207 |
17,718 |
|||||
Non-controlling interests |
2,999 |
2,075 |
1,441 |
1,016 |
4,937 |
|||||
19,233 |
10,633 |
8,168 |
5,223 |
22,655 |
||||||
Comprehensive income attributable to: |
||||||||||
Equity holders of the Company |
22,536 |
15,773 |
14,575 |
10,188 |
33,254 |
|||||
Non-controlling interests |
2,352 |
5,863 |
1,518 |
3,589 |
8,971 |
|||||
24,888 |
21,636 |
16,093 |
13,777 |
42,225 |
||||||
Earnings per share attributable to equity holders of the Company (in U.S. dollars): |
||||||||||
Basic and diluted earnings per share |
0.15 |
0.08 |
0.06 |
0.04 |
0.17 |
|||||

 View original content to download multimedia:https://www.prnewswire.com/news-releases/turpaz-industries-ltd-announces-record-second-quarter-and-first-half-2026-results-302848185.html
SOURCE Turpaz Industries
