
- PRICING
- LIVE QUOTES
- LEARN
- HELP


EN
Imperial Metals (TSX:III) Reported Softer Earnings, Is The Recent Rally Already Priced In?
What Imperial Metals’ Softer Earnings Mean For Investors
Imperial Metals (TSX:III) recently reported second quarter and six month 2026 results that showed lower sales and net income than a year earlier. The update has put renewed focus on earnings quality, margins, and stock momentum.
See our latest analysis for Imperial Metals.
Imperial Metals’ share price has responded strongly to the latest earnings with a 3.39% 1 day gain and a 33.53% 90 day share price return, even though the year to date share price return is down 11.16%. The CA$8.84 share price sits alongside a very strong 1 year total shareholder return of 103.22% and a 3 year total shareholder return of 245.31%. This reflects how investors are weighing softer recent earnings against longer term expectations and risk.
If this kind of volatility has your attention, it can help to see what else is moving in related areas of the market through the 9 top copper producer stocks. You may spot miners with different balance sheet strength or project profiles that better fit your risk tolerance.
After softer earnings and a sharp rebound in Imperial Metals’ share price, the key tension is clear: Has the recent 90 day surge already captured most of the upside, or does the current valuation still leave meaningful room ahead?
Price-to-Earnings of 14.5x for Imperial Metals: Is It Justified?
At a CA$8.84 share price, Imperial Metals is trading on a P/E of 14.5x, which sits slightly above its closest peer average of 14x, but below both the wider Canadian metals and mining industry on 15.9x and the broader Canadian market on 16.5x. That mix of readings suggests the market is not treating the stock as either a clear bargain or an obvious outlier.
The P/E multiple compares the current share price with the company’s earnings per share. For a miner like Imperial Metals, this measure often reflects how investors weigh current profitability against the quality and durability of future earnings, including factors such as mine life, asset mix and jurisdiction.
Imperial Metals screens as good value when lined up against the broader Canadian market and the wider industry, but it looks a little expensive compared to its closest peer group on 14x. Investors are also dealing with a drop in profit margins, which have moved from 28.1% to 16.4%, and earnings that declined 38.8% over the past year even though the company became profitable over the past 5 years with very strong average earnings growth. That combination can help explain why the market multiple sits in a middle ground rather than at a clear discount.
Compared with the Canadian metals and mining industry on 15.9x and the broader Canadian market on 16.5x, Imperial Metals’ 14.5x P/E is meaningfully lower. Yet against its peer average of 14x the stock is on a slightly higher multiple, which points to investors assigning a modest premium relative to that narrower group.
See what the numbers say about this price — find out in our valuation breakdown.
Result: Price-to-Earnings of 14.5x (ABOUT RIGHT)
However, investors still face risks related to softer margins and earnings, as well as the potential for project or jurisdiction setbacks across Imperial Metals’ diversified asset base.
Find out about the key risks to this Imperial Metals narrative.
Another View On Imperial Metals’ Valuation
The earlier P/E discussion painted Imperial Metals as roughly in the middle of the pack. Our DCF model offers a different angle. It suggests a fair value of about CA$6.89 per share compared with the current CA$8.84 price, which points to the stock trading at a premium. That kind of gap can either close through price moves or through changes in future cash flow expectations. Which outcome do you consider more likely?
Look into how the SWS DCF model arrives at its fair value.
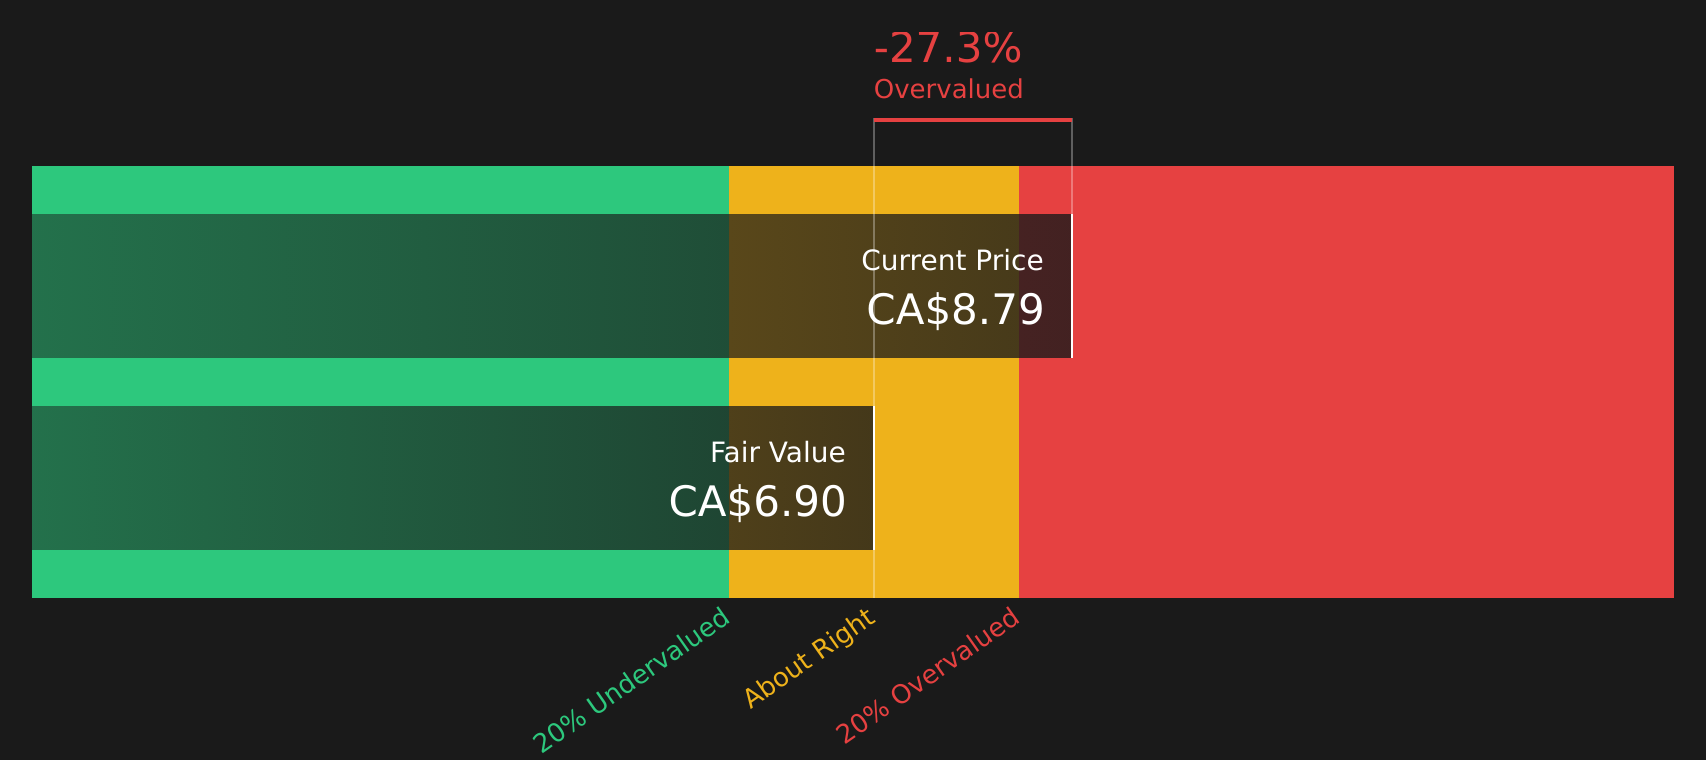
Simply Wall St performs a discounted cash flow (DCF) on every stock in the world every day (check out Imperial Metals for example). We show the entire calculation in full. You can track the result in your watchlist or portfolio and be alerted when this changes, or use our stock screener to discover 13 high quality undervalued stocks. If you save a screener we even alert you when new companies match - so you never miss a potential opportunity.
Next Steps
With mixed signals around Imperial Metals’ valuation, risks and recent earnings, it makes sense to look at the underlying data yourself and move quickly to form your own view. To see how the current risk concerns and potential rewards balance out in one place, review the 1 key reward and 1 important warning sign.
Looking For More Ideas Beyond Imperial Metals?
If Imperial Metals has sharpened your focus on valuations and risk, do not stop here. Use the Simply Wall St screener to compare fresh ideas side by side.
- Target higher potential upside by scanning companies that currently look mispriced using the 13 high quality undervalued stocks.
- Build a more resilient core in your portfolio by focusing on companies with strong finances through the solid balance sheet and fundamentals stocks screener (12 results).
- Spot underfollowed opportunities early by checking the screener containing 8 high quality undiscovered gems before they attract wider attention.
This article by Simply Wall St is general in nature. We provide commentary based on historical data and analyst forecasts only using an unbiased methodology and our articles are not intended to be financial advice. It does not constitute a recommendation to buy or sell any stock, and does not take account of your objectives, or your financial situation. We aim to bring you long-term focused analysis driven by fundamental data. Note that our analysis may not factor in the latest price-sensitive company announcements or qualitative material. Simply Wall St has no position in any stocks mentioned.
Have feedback on this article? Concerned about the content? Get in touch with us directly. Alternatively, email editorial-team@simplywallst.com