
- PRICING
- LIVE QUOTES
- LEARN
- HELP


EN
Lumine Group (TSXV:LMN) Could Be 47% Undervalued After Mixed Earnings
Mixed earnings picture after Lumine Group’s latest quarterly report
Lumine Group (TSXV:LMN) recently reported second quarter 2026 results that showed higher revenue alongside lower net income and earnings per share. This gives you a mixed snapshot of how the business is progressing.
For the quarter ended June 30, 2026, Lumine Group reported revenue of US$235.06 million compared with US$183.96 million a year earlier. Net income was US$15.44 million compared with US$23.55 million, and basic earnings per share from continuing operations was US$0.06 compared with US$0.09.
Across the first six months of 2026, revenue was US$443.41 million compared with US$362.65 million in the same period of 2025. Net income for the half was US$34.45 million compared with US$44.33 million, with basic earnings per share from continuing operations at US$0.13 compared with US$0.17.
Those figures point to a company that is bringing in more sales while seeing pressure on profitability. For investors reviewing Lumine Group stock in August 2026, a central question is how to interpret that shift in margins and earnings.
See our latest analysis for Lumine Group.
The mixed second quarter earnings have landed alongside a sharp swing in Lumine Group’s share price. The stock’s 1 month share price return of 20% and 3 month share price return of 28.22% suggest short term momentum is building. This comes even though the year to date share price return is down 2.22% and the 1 year total shareholder return is down 50%. However, the 3 year total shareholder return of 26.74% points to a much stronger earlier period.
If Lumine Group’s recent move has you rethinking where growth and risk might be shifting in software and related technologies, it can help to compare it with other fast moving opportunities through the 3 top founder-led companies
Lumine Group is producing higher sales while profits come under pressure and the share price rebounds sharply. The business story looks solid on the surface. Is the current valuation really as attractive as the recent move suggests?
Price-to-earnings of 44x on Lumine Group: Is it justified?
Lumine Group closed at CA$26.40, and the company is trading at a P/E of 44x based on current earnings. That puts a clear question in front of you about how much future profit strength is already reflected in the share price.
The P/E ratio compares the current share price to earnings per share. For a software business like Lumine Group, this multiple usually reflects how strongly the market expects earnings to grow over time, since much of the value often comes from future profit streams rather than current results.
Here, the signals conflict. On one hand, Lumine Group is flagged as trading at a 47.3% discount to an estimated fair value and the SWS DCF model estimates the present value of future cash flows at CA$50.05 per share. On the other hand, the current 44x P/E is above the estimated fair P/E of 29.3x. This suggests the market price already embeds a richer earnings multiple than that regression based fair ratio points to.
Compared with peers, the contrast gets sharper. Lumine Group’s 44x P/E is higher than the North American software industry average of 33.9x, which signals a premium against the broader sector. Yet it is below the peer group average of 63x, which points to a lower valuation relative to a closer set of comparable companies that trade on even higher earnings multiples. If the fair P/E of 29.3x is used as a yardstick, there is a clear gap between where the market is currently pricing Lumine Group and the level that regression analysis suggests the multiple could move toward over time.
Explore the SWS fair ratio for Lumine Group.
Result: Price-to-earnings of 44x (OVERVALUED)
However, there are clear risks if Lumine Group’s profitability stays under pressure or if the current 44x P/E contracts toward the lower industry or fair value estimates.
Find out about the key risks to this Lumine Group narrative.
Another view on Lumine Group’s value
The earlier P/E check suggested Lumine Group looks expensive relative to its fair ratio and the wider software industry. The SWS DCF model tells a different story. It estimates fair value at CA$50.05 per share, which is above the current CA$26.40 price and flags the stock as trading at a discount.
This wide gap between the earnings multiple view and the DCF output raises a practical question. Is the market overpaying for today’s earnings or underpricing Lumine Group’s longer term cash flow potential, and which lens do you want to lean on in your own work?
Look into how the SWS DCF model arrives at its fair value.
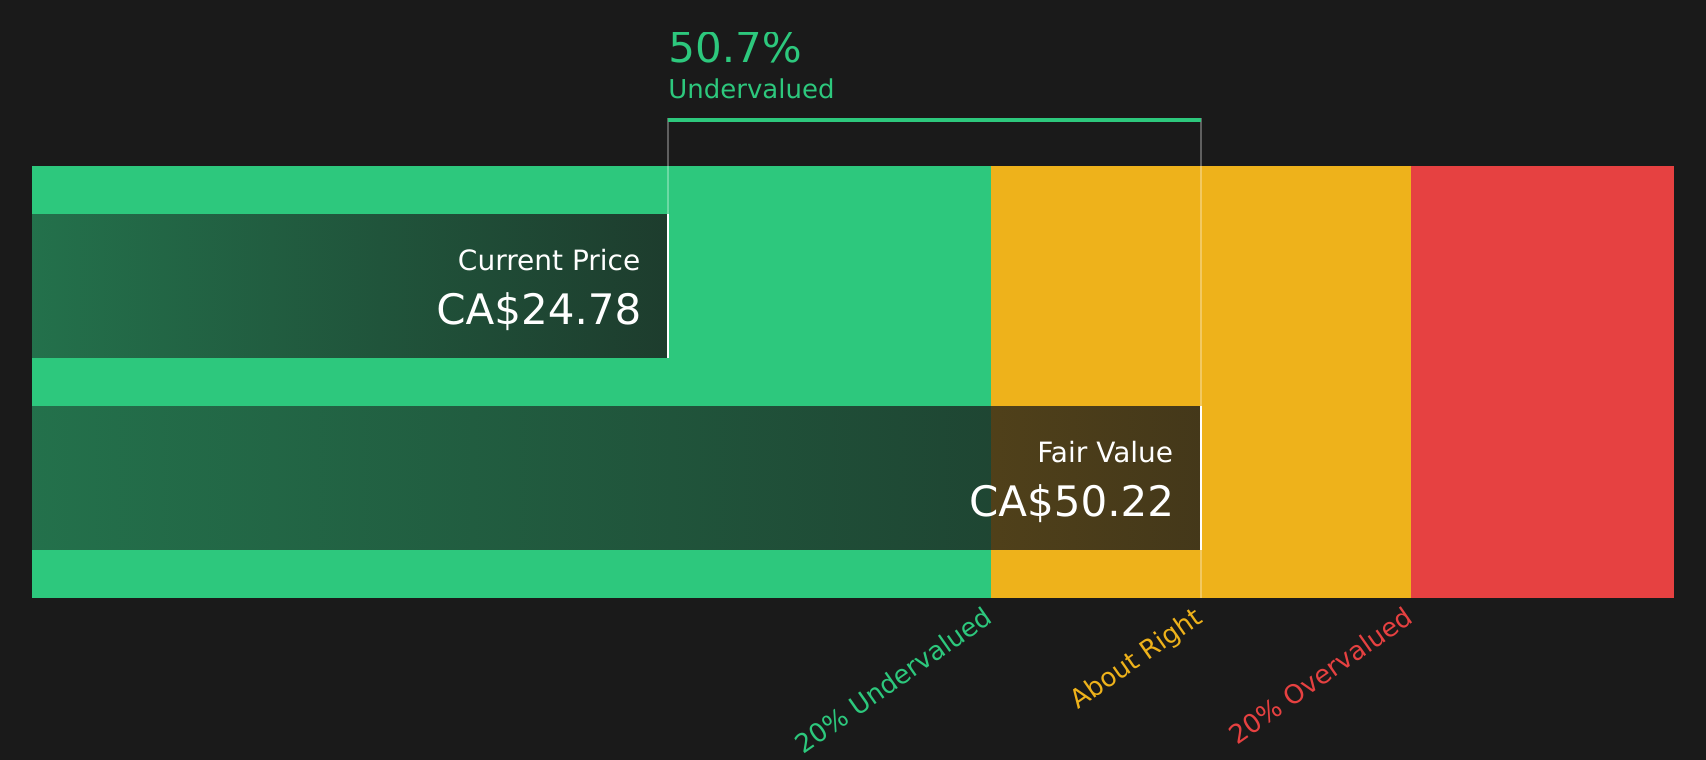
Simply Wall St performs a discounted cash flow (DCF) on every stock in the world every day (check out Lumine Group for example). We show the entire calculation in full. You can track the result in your watchlist or portfolio and be alerted when this changes, or use our stock screener to discover 14 high quality undervalued stocks. If you save a screener we even alert you when new companies match - so you never miss a potential opportunity.
Next Steps
The mixed signals around Lumine Group can feel confusing, so it helps to move quickly and check the underlying data for yourself today. To see what investors are optimistic about, review the 3 key rewards.
Looking for more investment ideas beyond Lumine Group?
If Lumine Group has you thinking more carefully about where you put fresh capital, this is the moment to widen your search and stress test your next moves.
- Target resilient cash flow stories by scanning companies with steady balance sheets and fundamentals through the solid balance sheet and fundamentals stocks screener (12 results).
- Hunt for potential mispriced opportunities by reviewing the 14 high quality undervalued stocks that match your risk and return preferences.
- Spot early stage possibilities others may be overlooking by checking the screener containing 8 high quality undiscovered gems before they attract wider attention.
This article by Simply Wall St is general in nature. We provide commentary based on historical data and analyst forecasts only using an unbiased methodology and our articles are not intended to be financial advice. It does not constitute a recommendation to buy or sell any stock, and does not take account of your objectives, or your financial situation. We aim to bring you long-term focused analysis driven by fundamental data. Note that our analysis may not factor in the latest price-sensitive company announcements or qualitative material. Simply Wall St has no position in any stocks mentioned.
Have feedback on this article? Concerned about the content? Get in touch with us directly. Alternatively, email editorial-team@simplywallst.com