
- PRICING
- LIVE QUOTES
- LEARN
- HELP


EN
AAON (NASDAQ:AAON) Delivers Impressive Q2 CY2026

Heating and cooling solutions company AAON (NASDAQ:AAON) reported Q2 CY2026 results topping the market’s revenue expectations, with sales up 101% year on year to $627 million. Its non-GAAP profit of $0.69 per share was 39.7% above analysts’ consensus estimates.
Is now the time to buy AAON? Find out by accessing our full research report, it’s free.
AAON (AAON) Q2 CY2026 Highlights:
- Revenue: $627 million vs analyst estimates of $503 million (101% year-on-year growth, 24.6% beat)
- Adjusted EPS: $0.69 vs analyst estimates of $0.49 (39.7% beat)
- Adjusted EBITDA: $94.18 million vs analyst estimates of $81.65 million (15% margin, 15.3% beat)
- Operating Margin: 11%, up from 7.7% in the same quarter last year
- Free Cash Flow was -$31.18 million compared to -$57.62 million in the same quarter last year
- Backlog: $1.97 billion at quarter end, up 76.3% year on year
- Market Capitalization: $7.77 billion
"Our second quarter results demonstrate the continued strength of demand for our solutions and the progress we are making scaling the company to meet that demand," said Matt Tobolski, President and CEO of AAON.
Company Overview
Backed by two million square feet of lab testing space, AAON (NASDAQ:AAON) makes heating, ventilation, and air conditioning equipment for different types of buildings.
Revenue Growth
A company’s long-term sales performance can indicate its overall quality. Even a bad business can shine for one or two quarters, but a top-tier one grows for years. Over the last five years, AAON grew its sales at an incredible 30.5% compounded annual growth rate. Its growth beat the average industrials company and shows its offerings resonate with customers.
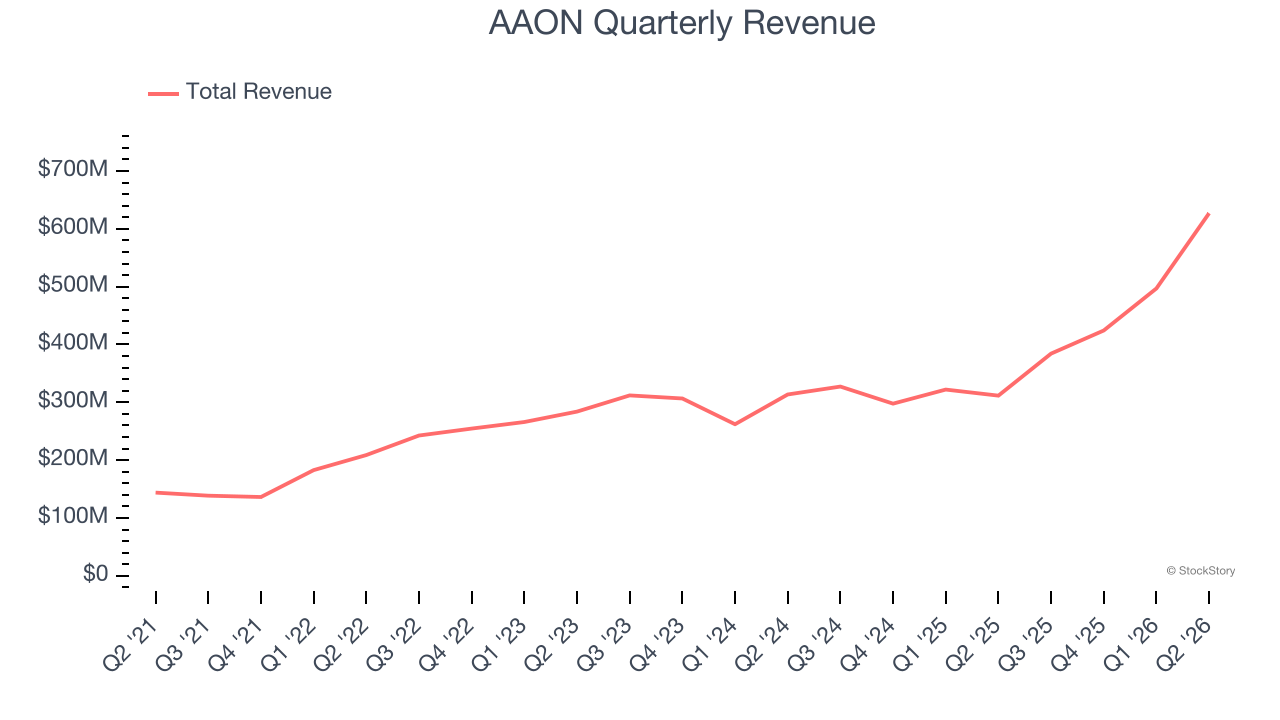
Long-term growth is the most important, but within industrials, a half-decade historical view may miss new industry trends or demand cycles. AAON’s annualized revenue growth of 27.2% over the last two years is below its five-year trend, but we still think the results suggest healthy demand. 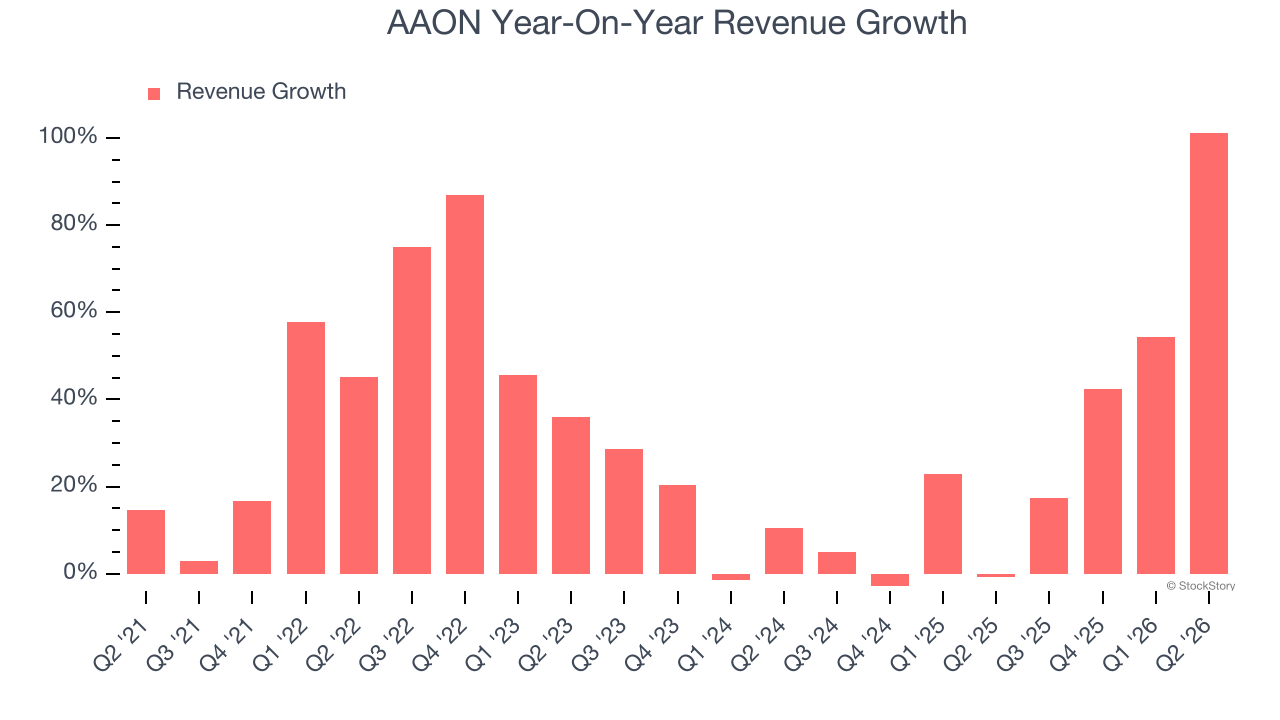
We can better understand the company’s revenue dynamics by analyzing its backlog, or the value of its outstanding orders that have not yet been executed or delivered. AAON’s backlog reached $1.97 billion in the latest quarter and averaged 93.5% year-on-year growth over the last two years. Because this number is better than its revenue growth, we can see the company accumulated more orders than it could fulfill and deferred revenue to the future. This could imply elevated demand for AAON’s products and services but raises concerns about capacity constraints. 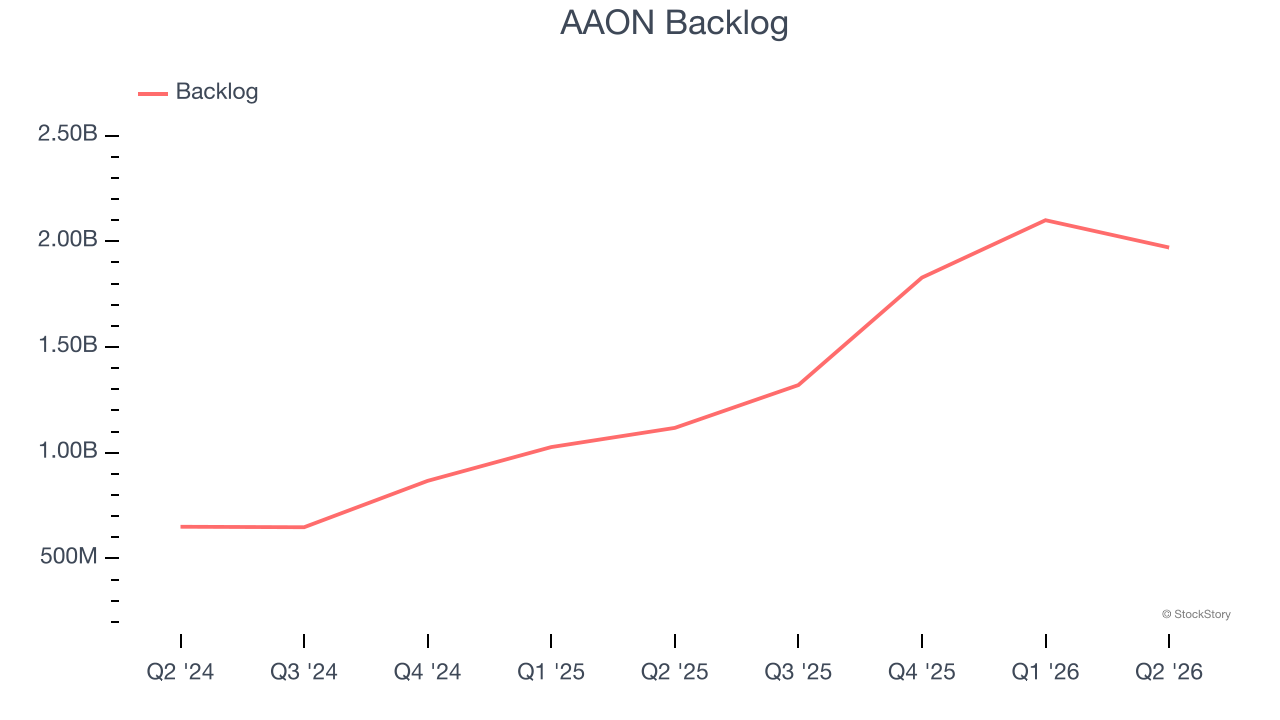
This quarter, AAON reported magnificent year-on-year revenue growth of 101%, and its $627 million of revenue beat Wall Street’s estimates by 24.6%.
Looking ahead, sell-side analysts expect revenue to grow 15.5% over the next 12 months, a deceleration versus the last two years. Despite the slowdown, this projection is healthy and indicates the market sees success for its products and services.
ONE MORE THING: 3 Hidden Platforms Growing 3X Faster than Amazon, Google, and PayPal. Amazon, Google, and Meta all followed the same playbook: Dominate an ignored market. Build an unbeatable moat. Scale until you’re unstoppable.
These three platforms are running that exact playbook right now. The early investors in Amazon made fortunes. The early investors in these could do the same. Get All 3 Stocks Here for FREE.
Operating Margin
Operating margin is an important measure of profitability as it shows the portion of revenue left after accounting for all core expenses — everything from the cost of goods sold to advertising and wages. It’s also useful for comparing profitability across companies with different levels of debt and tax rates because it excludes interest and taxes.
AAON’s operating margin has generally stayed the same over the last 12 months, averaging 14.4% over the last five years. This profitability was top-notch for an industrials business, showing it’s a well-run company with an efficient cost structure. This was particularly impressive because of its low gross margin, which is mostly a factor of what it sells and takes huge shifts to move meaningfully. Companies have more control over their operating margins, and it’s a show of well-managed operations if they’re high when gross margins are low.
Analyzing the trend in its profitability, AAON’s operating margin might have fluctuated slightly but has generally stayed the same over the last five years. This raises questions about the company’s expense base because its revenue growth should have given it leverage on its fixed costs, resulting in better economies of scale and profitability.
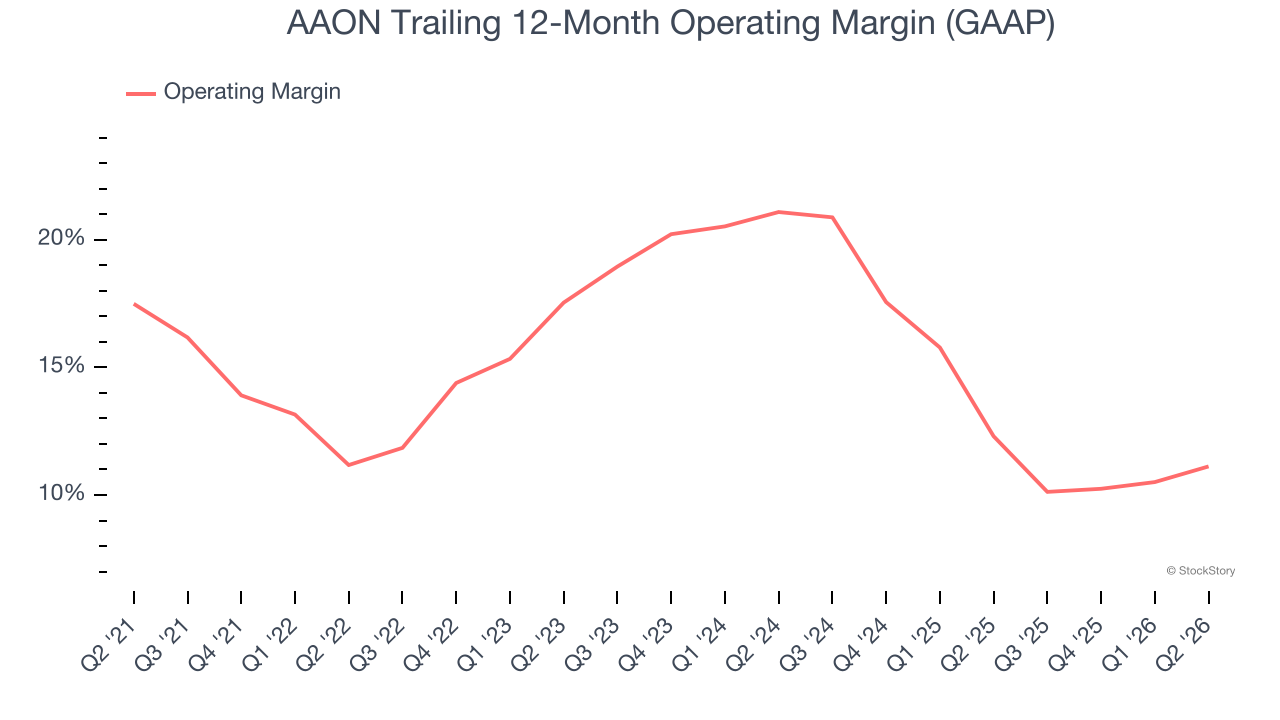
In Q2, AAON generated an operating margin profit margin of 11%, up 3.3 percentage points year on year. The increase was encouraging, and because its gross margin actually decreased, we can assume it was more efficient because its operating expenses like marketing, R&D, and administrative overhead grew slower than its revenue.
Earnings Per Share
Revenue trends explain a company’s historical growth, but the long-term change in earnings per share (EPS) points to the profitability of that growth — for example, a company could inflate its sales through excessive spending on advertising and promotions.
AAON’s EPS grew at a spectacular 15.5% compounded annual growth rate over the last five years. However, this performance was lower than its 30.5% annualized revenue growth, telling us the company became less profitable on a per-share basis as it expanded.
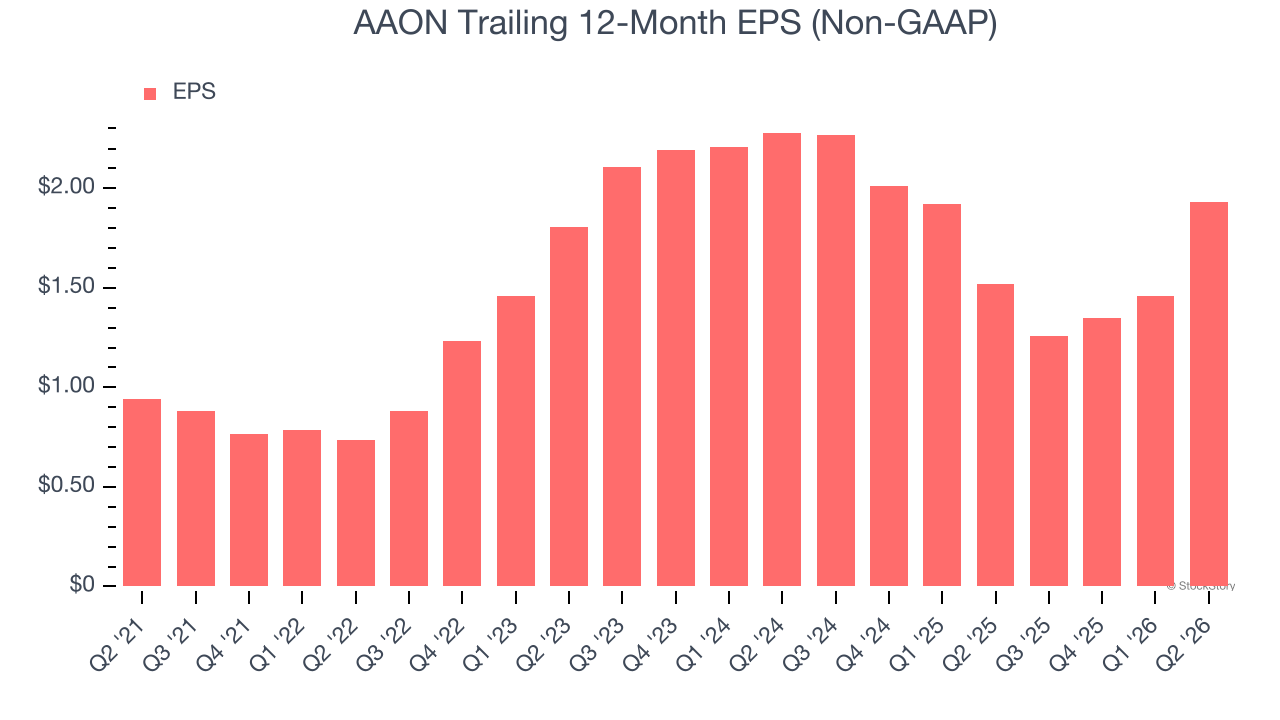
Diving into the nuances of AAON’s earnings can give us a better understanding of its performance. A five-year view shows AAON has diluted its shareholders, growing its share count by 4.1%. This has led to lower per share earnings. Taxes and interest expenses can also affect EPS but don’t tell us as much about a company’s fundamentals. 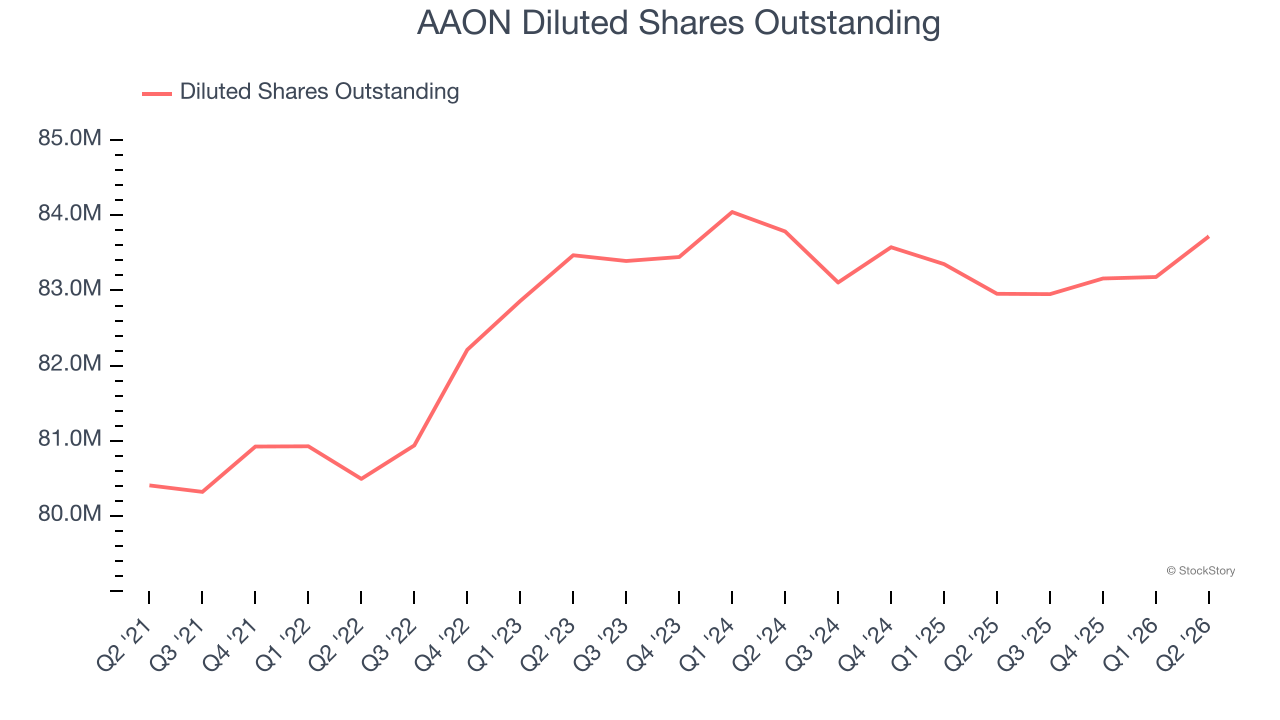
Like with revenue, we analyze EPS over a more recent period because it can provide insight into an emerging theme or development for the business.
For AAON, its two-year annual EPS declines of 8% mark a reversal from its (seemingly) healthy five-year trend. These shorter-term results weren’t ideal, but given it was successful in other measures of financial health, we’re hopeful AAON can return to earnings growth in the future.
In Q2, AAON reported adjusted EPS of $0.69, up from $0.22 in the same quarter last year. This print easily cleared analysts’ estimates, and shareholders should be content with the results. Over the next 12 months, Wall Street expects AAON’s full-year EPS to grow 40.1% from $1.93 to $2.70.
Key Takeaways from AAON’s Q2 Results
It was good to see AAON beat analysts’ EPS expectations this quarter. We were also excited its EBITDA outperformed Wall Street’s estimates by a wide margin. Zooming out, we think this was a solid print. The stock remained flat at $90 immediately after reporting.
Indeed, AAON had a rock-solid quarterly earnings result, but is this stock a good investment here? We think that the latest quarter is only one piece of the longer-term business quality puzzle. Quality, when combined with valuation, can help determine if the stock is a buy. We cover that in our actionable full research report which you can read here (it’s free).