
- PRICING
- LIVE QUOTES
- LEARN
- HELP


EN
European Penny Stocks To Watch In August 2026
Amid a backdrop of resilient earnings and firmer risk appetite, European equities have shown strength, with the pan-European STOXX Europe 600 Index rising by 1.70% in local currency terms. As investors navigate these conditions, penny stocks—often representing smaller or newer companies—continue to offer unique opportunities for growth when backed by robust financial health. Despite being considered a niche area, penny stocks can still provide significant potential for those seeking value and growth beyond the traditional market leaders.
We're going to check out a few of the best picks from our screener tool.
Cairo Communication (BIT:CAI)
Simply Wall St Financial Health Rating: ★★★★☆☆
Overview: Cairo Communication S.p.A. is a communication company operating in Italy and Spain with a market cap of €284.17 million.
Operations: The company's revenue is primarily derived from RCS (€833.3 million), advertising (€345.7 million), magazine publishing in Cairo (€72.6 million), and TV publishing La7 and network operations (€119 million).
Market Cap: €284.17M
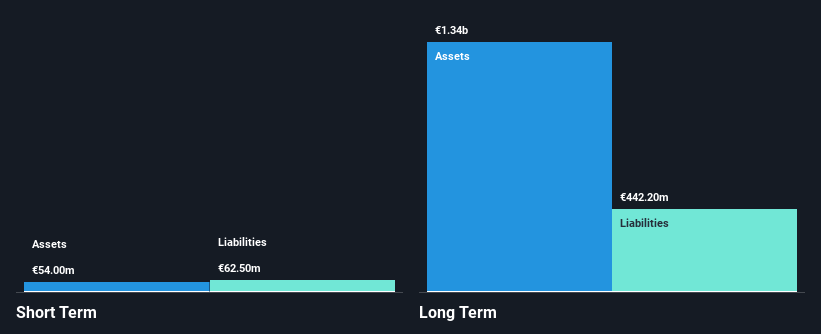
Cairo Communication S.p.A., with a market cap of €284.17 million, faces challenges typical for penny stocks. Despite trading slightly below its estimated fair value and being debt-free, the company struggles with declining earnings and net profit margins, which have decreased from 4.2% to 3.4% over the past year. Recent earnings reports show a slight drop in revenue and net income compared to previous periods, highlighting ongoing financial pressures. The board's experience contrasts with unstable dividends and insufficient short-term assets to cover liabilities, raising concerns about long-term sustainability despite no shareholder dilution recently.
- Navigate through the intricacies of Cairo Communication with our comprehensive balance sheet health report here.
- Understand Cairo Communication's earnings outlook by examining our growth report.
I.M.D. International Medical Devices (BIT:IMD)
Simply Wall St Financial Health Rating: ★★★★★☆
Overview: I.M.D. International Medical Devices S.p.A. operates in the medical device industry and has a market cap of €22.52 million.
Operations: The company generates revenue from its Medical Imaging Systems segment, amounting to €34.50 million.
Market Cap: €22.52M
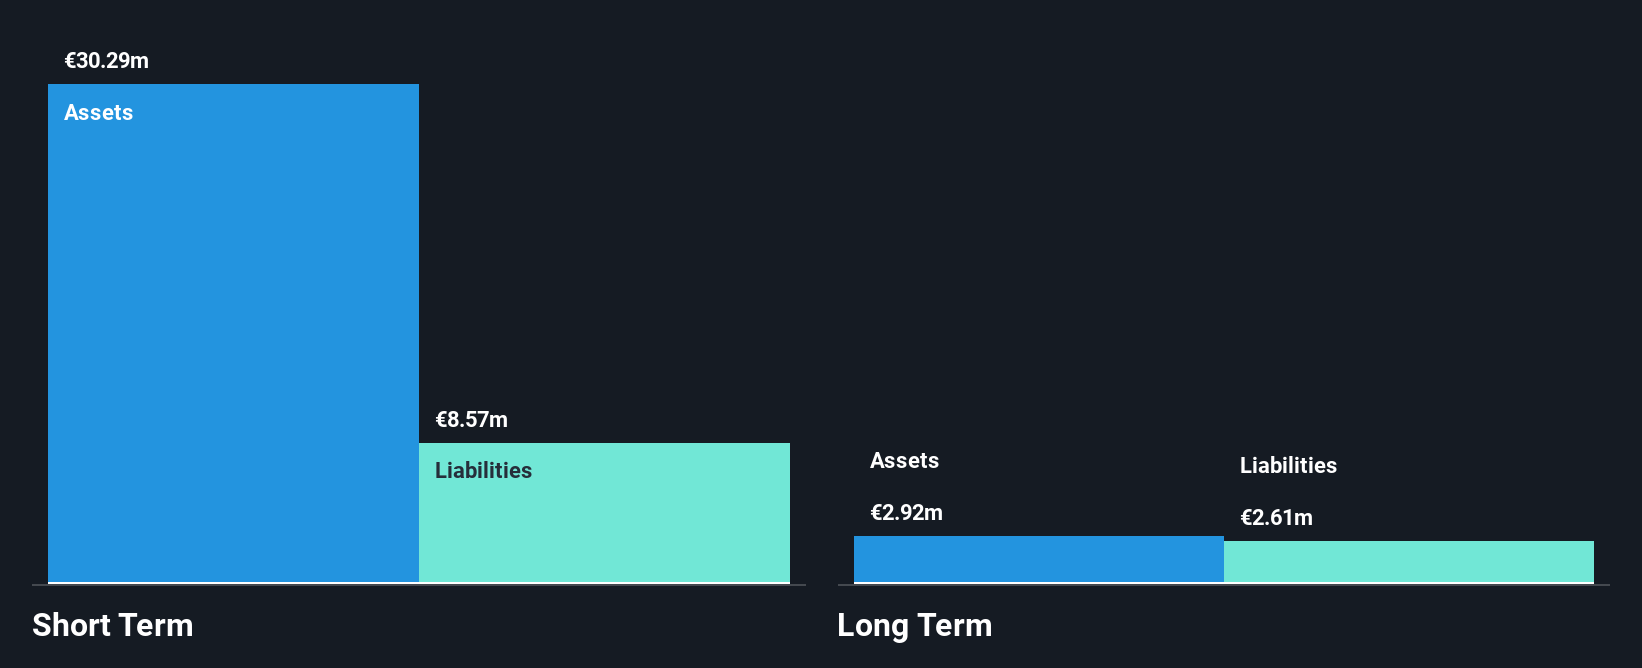
I.M.D. International Medical Devices S.p.A., with a market cap of €22.52 million, presents a mixed picture typical of penny stocks. The company generates €34.50 million from its Medical Imaging Systems segment but struggles with declining earnings, down 25% annually over five years, and shrinking net profit margins from 5.6% to 4.1%. Despite low return on equity at 6.1%, the company benefits from strong interest coverage and well-covered debt by operating cash flow (960.7%). Short-term assets exceed liabilities, but dividends are not well covered by earnings or free cash flow, raising sustainability concerns despite stable shareholder dilution and board experience.
- Click to explore a detailed breakdown of our findings in I.M.D. International Medical Devices' financial health report.
- Evaluate I.M.D. International Medical Devices' prospects by accessing our earnings growth report.
Aquila Part Prod Com (BVB:AQ)
Simply Wall St Financial Health Rating: ★★★★★★
Overview: Aquila Part Prod Com S.A. operates in distribution and logistics services across Romania, Moldova, Poland, the Netherlands, Germany, Hungary, and other international markets with a market cap of RON2.46 billion.
Operations: The company's revenue is primarily derived from its Distribution segment at RON3.39 billion, followed by Logistics at RON113.58 million and Transport at RON62.13 million.
Market Cap: RON2.46B
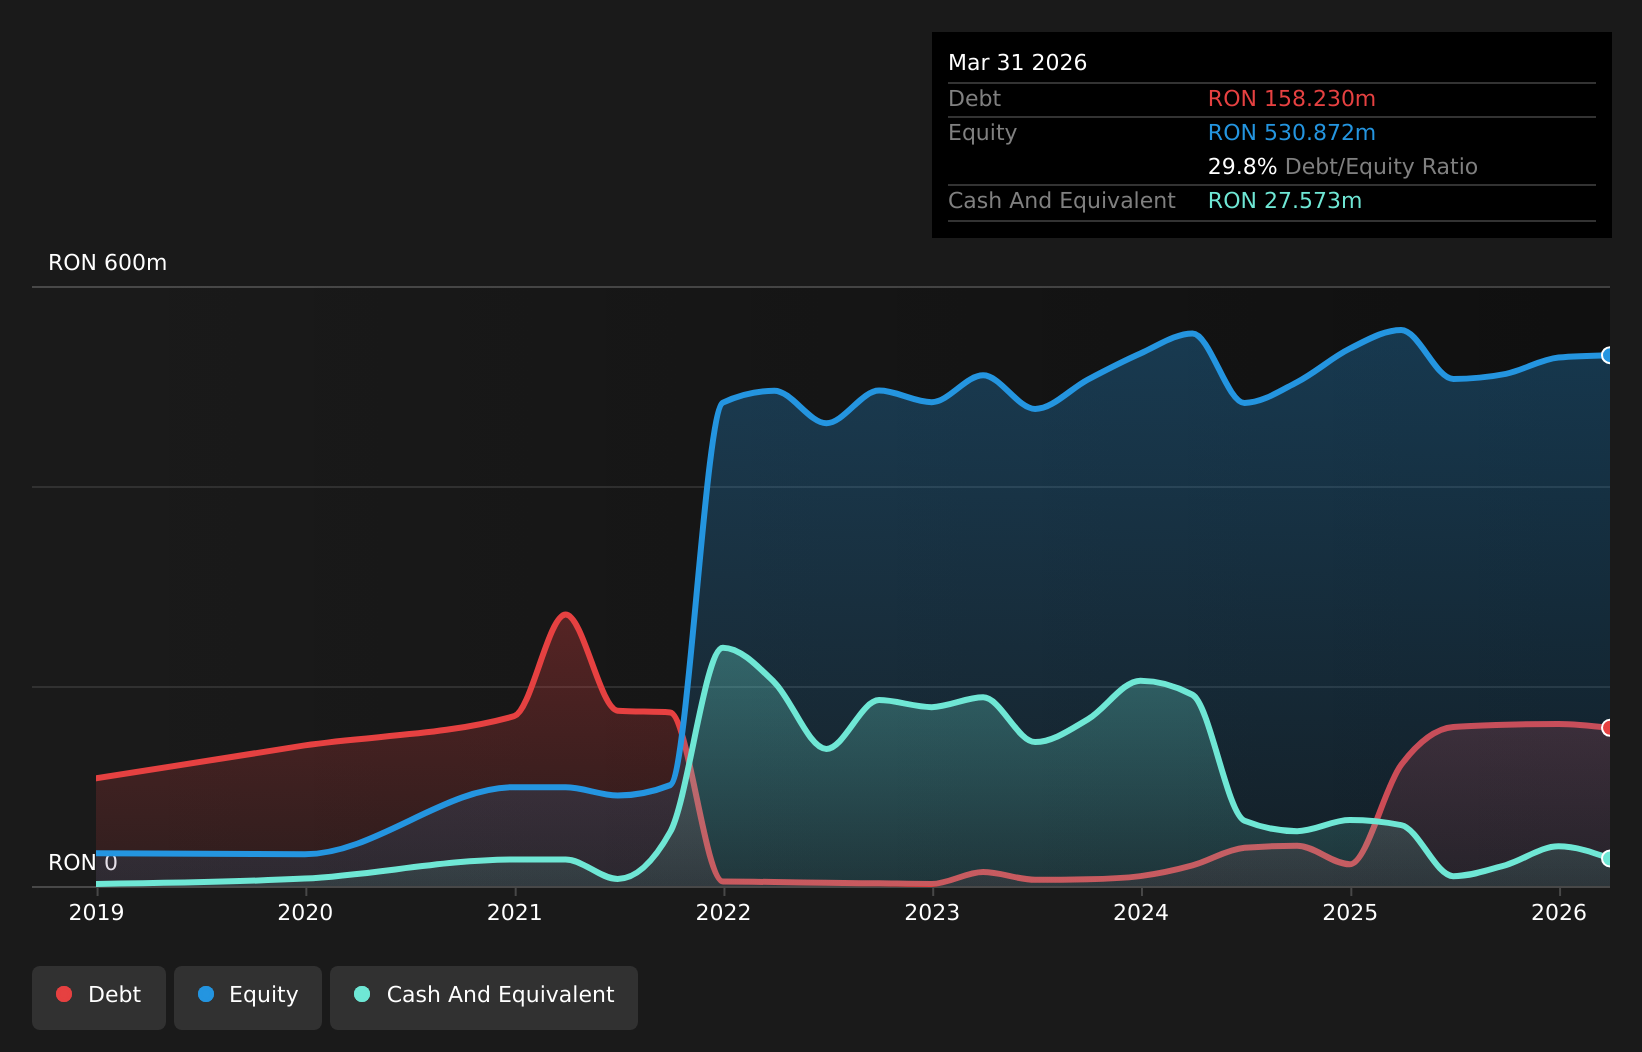
Aquila Part Prod Com S.A., with a market cap of RON2.46 billion, shows characteristics common to penny stocks, balancing growth prospects with challenges. The company reported first-quarter sales of RON835.29 million, an increase from the previous year, yet net income declined significantly to RON3.29 million from RON19.02 million. While its profit margins have decreased to 1%, Aquila benefits from high-quality earnings and strong debt management—short-term assets cover liabilities and operating cash flow covers debt well (41.1%). Despite negative earnings growth over the past year, forecasts suggest potential for substantial annual earnings growth ahead (50.46%).
- Get an in-depth perspective on Aquila Part Prod Com's performance by reading our balance sheet health report here.
- Gain insights into Aquila Part Prod Com's future direction by reviewing our growth report.
Next Steps
- Investigate our full lineup of 303 European Penny Stocks right here.
- Interested In Other Possibilities? Diversify your portfolio with solid dividend payers offering reliable income streams to weather potential market turbulence.
This article by Simply Wall St is general in nature. We provide commentary based on historical data and analyst forecasts only using an unbiased methodology and our articles are not intended to be financial advice. It does not constitute a recommendation to buy or sell any stock, and does not take account of your objectives, or your financial situation. We aim to bring you long-term focused analysis driven by fundamental data. Note that our analysis may not factor in the latest price-sensitive company announcements or qualitative material. Simply Wall St has no position in any stocks mentioned.
Have feedback on this article? Concerned about the content? Get in touch with us directly. Alternatively, email editorial-team@simplywallst.com