
- PRICING
- LIVE QUOTES
- LEARN
- HELP


EN
Avista (AVA) Earnings Growth And Dividend Keep Fair Value In Focus
Why Avista Stock Is Back On Investors’ Radar
Avista (AVA) has drawn fresh attention after reporting higher second quarter net income and earnings per share compared with a year earlier, along with a reaffirmed quarterly dividend that keeps income focused investors watching the stock.
See our latest analysis for Avista.
Despite the stronger second quarter results and reaffirmed dividend, Avista’s recent share price momentum has been soft, with a 30 day share price return of 7.57% and a 90 day share price return of 4.79% in the same direction. Even so, the stock’s 1 year total shareholder return of 8.99% and 3 year total shareholder return of 24.10% suggest that longer term holders have seen steadier compounding from both price moves and dividends.
If Avista’s income profile has your attention, it can also be useful to see how other utility related plays are trading through the energy transition cycle using our 37 power grid technology and infrastructure stocks
Bulls point to Avista’s higher earnings and steady dividend, while bears focus on the recent share price softness and potential valuation risk. Do the numbers suggest this pullback is an entry opportunity, or a value trap?
Most Popular Narrative: 10% Undervalued
The most followed narrative currently places Avista’s fair value at $42.80, compared with the last close of $38.73, which implies a valuation gap that bullish investors are watching closely.
The sharp rise in large industrial and commercial load inquiries, with over 3,000 megawatts in the pipeline compared to a roughly 2,000-megawatt current peak load, signals accelerating electrification and potential for outsized rate base and revenue growth if even a fraction of these loads materialize over the next 3 to 5 years.
Read the complete narrative. Read the complete narrative.
This fair value hinges on a specific earnings path, firmer margins, and a future earnings multiple that sits below the wider integrated utilities group. Want to see exactly how those moving parts add up and which assumptions matter most for Avista over the next few years?
Result: Fair Value of $42.80 (UNDERVALUED)
Have a read of the narrative in full and understand what's behind the forecasts.
However, Avista’s geographically concentrated footprint, along with rising spend on grid upgrades and wildfire mitigation, could pressure earnings resilience and challenge the current undervalued narrative if recovery lags.
Find out about the key risks to this Avista narrative.
Another View On Avista’s Valuation
The first narrative framed Avista as about 10% undervalued, yet the SWS DCF model tells a more cautious story. On that view, Avista’s current share price of $38.73 sits above an estimated future cash flow value of $35.21, which points to a stock that screens as overvalued instead.
This split between earnings based fair value and the SWS DCF model raises a straightforward question for investors: Which set of assumptions on growth and cash generation feels more realistic for Avista over the coming years, and how comfortable are you backing that side of the argument?
Look into how the SWS DCF model arrives at its fair value.
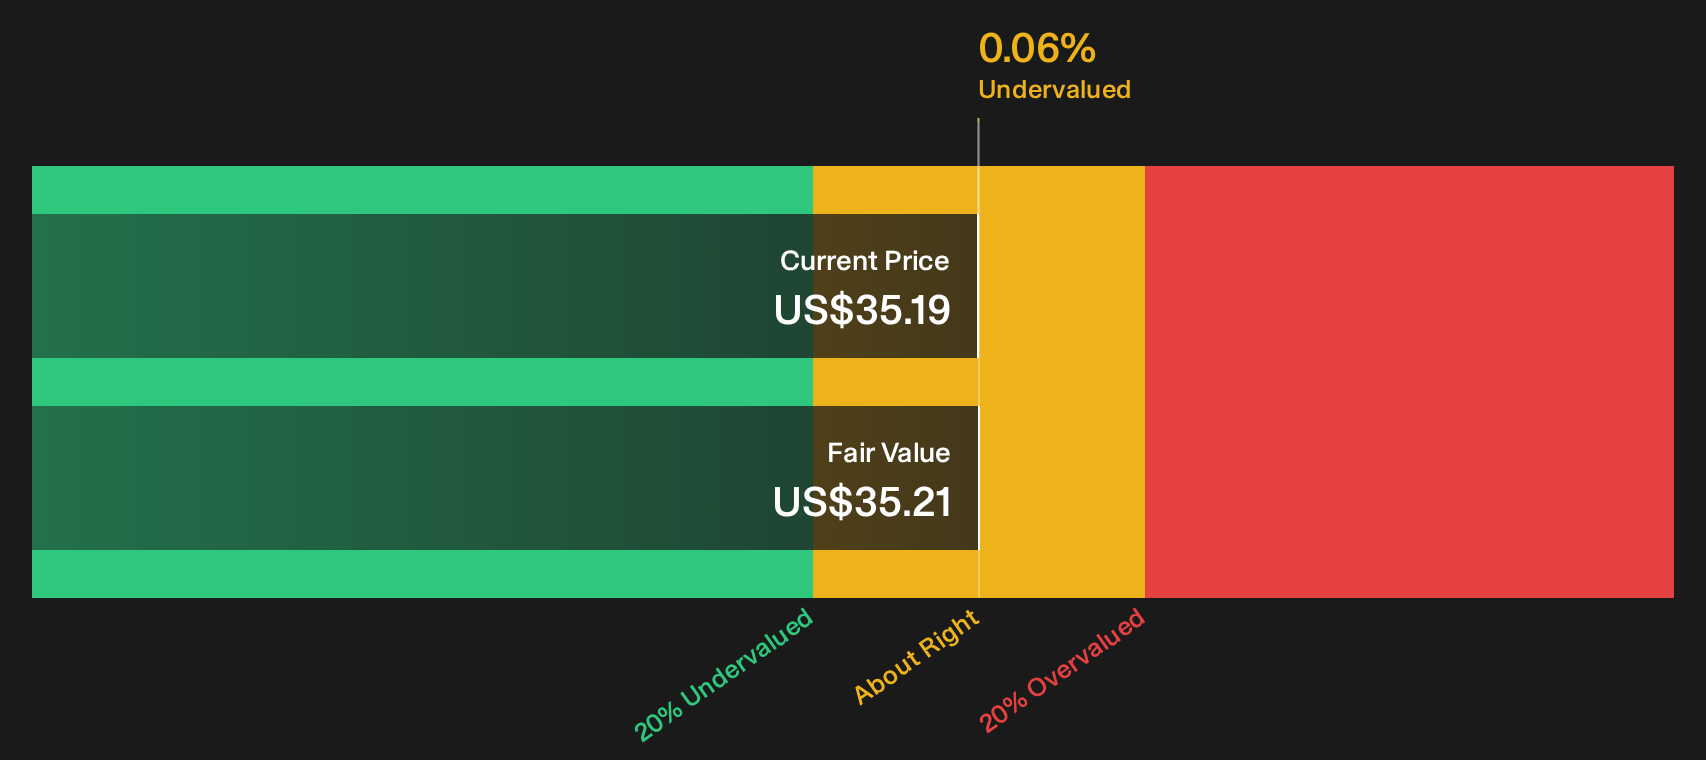
Simply Wall St performs a discounted cash flow (DCF) on every stock in the world every day (check out Avista for example). We show the entire calculation in full. You can track the result in your watchlist or portfolio and be alerted when this changes, or use our stock screener to discover 52 high quality undervalued stocks. If you save a screener we even alert you when new companies match - so you never miss a potential opportunity.
Next Steps
With mixed signals around Avista’s valuation and outlook, sentiment is clearly split. It makes sense to move fast and weigh the data yourself using the 4 key rewards and 2 important warning signs.
Looking for more investment ideas beyond Avista?
If Avista has sharpened your focus, now is the moment to broaden your watchlist. Fresh ideas today can be the opportunities others only notice later.
- Target resilient balance sheets and steady fundamentals by scanning companies on the solid balance sheet and fundamentals stocks screener (48 results).
- Hunt for quality at a discount by reviewing companies highlighted in the 52 high quality undervalued stocks.
- Spot potential future standouts before they are crowded trades by checking the screener containing 21 high quality undiscovered gems.
This article by Simply Wall St is general in nature. We provide commentary based on historical data and analyst forecasts only using an unbiased methodology and our articles are not intended to be financial advice. It does not constitute a recommendation to buy or sell any stock, and does not take account of your objectives, or your financial situation. We aim to bring you long-term focused analysis driven by fundamental data. Note that our analysis may not factor in the latest price-sensitive company announcements or qualitative material. Simply Wall St has no position in any stocks mentioned.
Have feedback on this article? Concerned about the content? Get in touch with us directly. Alternatively, email editorial-team@simplywallst.com