
- PRICING
- LIVE QUOTES
- LEARN
- HELP


EN
League of Nations Minsheng Securities: What is the pricing of US bonds?
The Zhitong Finance App learned that Guolian Minsheng Securities released a research report saying that since this year, the accelerated rise in US bond interest rates has become the focus of global asset pricing, and the upward shift in risk-free interest rates suppresses equity valuations and boosts volatility. In the first half of the year, the market's main pricing economy recovered and the monetary policy shift under energy shocks. Short-term interest rates rose rapidly in line with expectations of interest rate hikes, and the yield curve showed a “bear flat” pattern. However, after July, short-term momentum slowed down due to weakening fundamentals and the Fed's hesitation to raise interest rates, while long-term interest rates accelerated, driven by term premiums, and the curve steepened and continued to strengthen. The bank believes that US bond pricing is shifting from being dominated by a single policy interest rate to a multi-dimensional framework where “fiscal risk premium+mismatch between supply and demand+policy uncertainty and long-term inflation risk” resonate. In the second half of the year, long-term interest rates tend to rise and fall, and the curve steepens or becomes a core clue. We need to focus on tracking variables such as fundamental data, fiscal gap and tariff hedging, foreign investment holdings reduction and AI corporate debt crowding out effects, and the progress of the Walsh reform.
The original text is as follows:
Since this year, the accelerated rise in US bond interest rates has once again become the focus of global asset pricing. Along with the rapid rise in US bond yields, risk-free interest rates, the pricing anchor for global financial assets, moved rapidly upward, not only directly suppressing equity asset valuations, but also triggered profound adjustments in cross-asset allocations. In the process, the negative correlation between US stocks and US bonds was once again revealed after being broken in stages, and the volatility of global financial markets was also pushed to a high level.
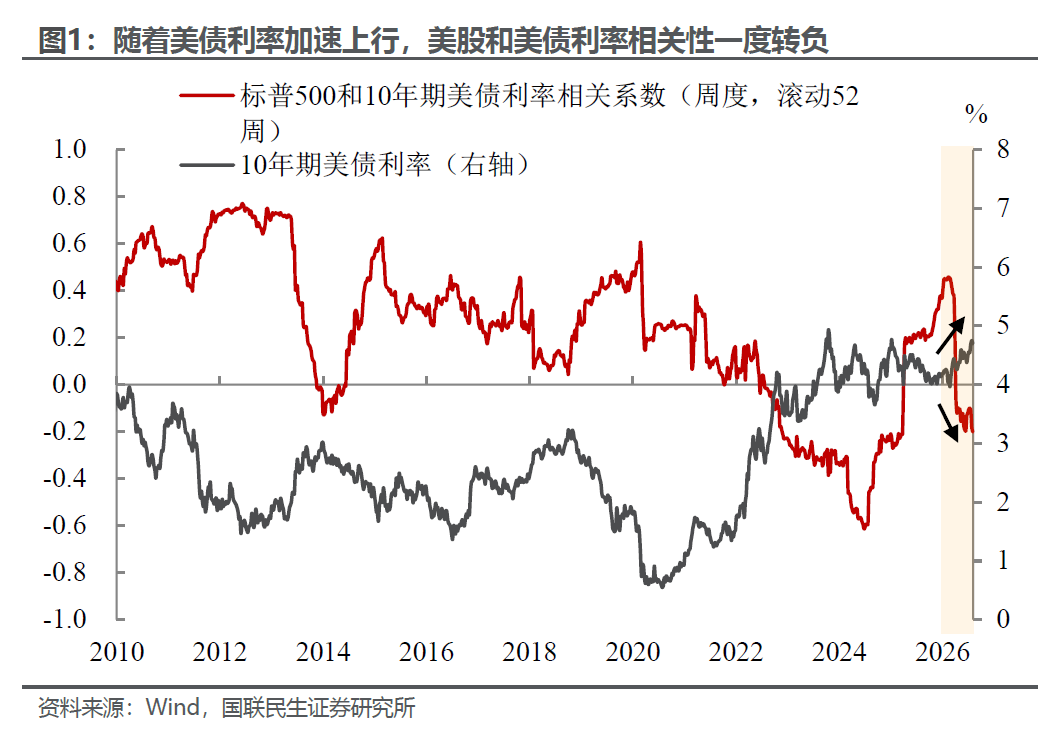
However, in the face of a rapid rise in interest rates on US bonds, the core factors driving this round of upward trend also seem to be changing. In the first half of the year (up to the end of June), the market's main pricing economy recovered and monetary policy shift under energy shocks: the Federal Reserve's policy expectations quickly reversed from cutting interest rates 1-2 times throughout the year at the beginning of the year to expectations of interest rate hikes. Short-term interest rates then rose rapidly and converged towards the long end, and the treasury bond yield curve emerged from a typical “bear flat” pattern.
However, after entering July, due to weakening fundamentals and the hesitation of the Federal Reserve's interest rate hike, short-term actions gradually slowed down, but in comparison, long-term interest rates increased at an accelerated pace. The trend of steeper yield curves continues to strengthen, and term premiums have taken over as the core driver for the upward trend in long-term interest rates.
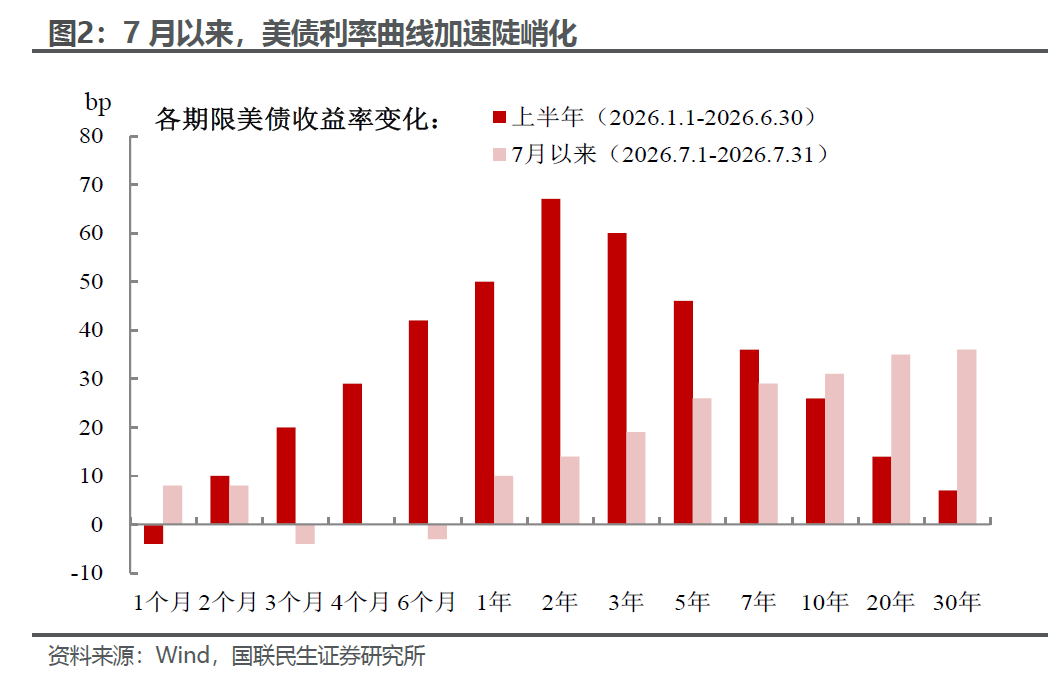
We believe that this shift may mean that the US bond market pricing framework is breaking away from the dominant model of interest rate expectations for a single policy and shifting to a multi-dimensional pricing system driven by resonances such as “fiscal risk premium+concerns about mismatch between supply and demand plus policy uncertainty and long-term inflation risk.” In this context, the ease and difficulty of long-term interest rates in the second half of the year and the steeper yield curve may become a core clue throughout the market.
1. What was the US bond market pricing in the first half of the year?
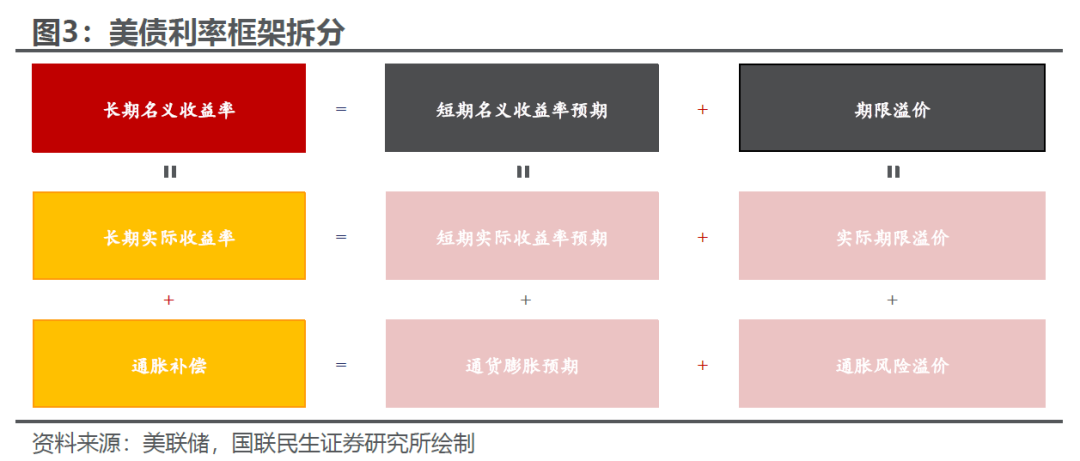
How should we understand the driving force behind the rise in US bond interest rates since the beginning of the year? Using the classical interest rate decomposition framework, nominal US bond yields can be split into expected short-term real interest rates, forward inflation expectations, and term premiums (actual term premium+inflation risk premium). Among them,
1) Expected short-term real interest rates reflect market consensus predictions on the Federal Reserve's short- and medium-term monetary policy path and long-term balanced real interest rate. The potential growth momentum (such as labor productivity, return on capital) directly linked to economic fundamentals and the pace of the Federal Reserve's policy shift;
2) Forward inflation expectations represent the financial market's pricing of medium- to long-term price stability and the Fed's ability to anchor inflation;
3) Term premiums are additional risk compensation required by investors due to bearing future uncertain risks faced by holding long-term bonds (such as the risk of uncertainty about interest rates and inflation, the risk of imbalance between supply and demand, and pressure to issue financial debt, etc.).
It is easy to see that the core driver of US bond interest rates in the first half of the year comes from expected short-term real interest rates. According to the DKW model's split of US bond interest rates (estimates for different models are slightly different, but the overall trend is similar, such as the common ACM model), interest rates on 10-year US bonds rose 23 BP in the first half of the year (up to June), of which short-term real interest rates are expected to rise by about 15 BPs, contributing about 65% of the nominal interest rate increase; while forward inflation expectations and term premiums only increased by about 4 BP, contributing only 35% in total.
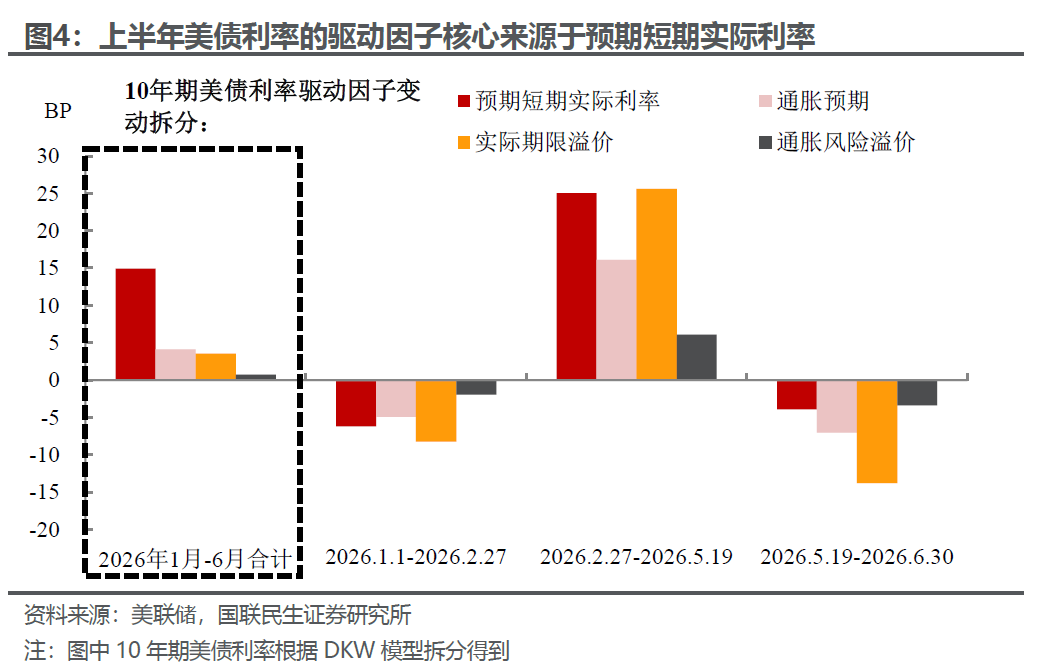
Specifically, the drivers of US debt after Iran's conflict showed obvious characteristics of a phased transition:
The first stage (the fermentation period of the geographical conflict: the outbreak of the Iranian conflict until mid-May): Resonance increased due to the three major factors. The sudden escalation of the situation in the Middle East led to a sharp rise in commodity prices such as crude oil. Geopolitical uncertainty was intertwined with supply-side inflation risks, leading to a pulsating rise in inflation expectations and term premiums in the short term. Meanwhile, America's strong economic data has further reduced expectations of interest rate cuts in the market. Short-term real interest rates are expected to rise at the same time. The resonance of the three is driving interest rates on 10-year US bonds to rise rapidly.
Phase 2 (geographic risk mitigation period: mid-May to end of June): inflation and term premiums ebb, and real interest rates stand alone. With the marginal easing of the situation in Iran and a significant drop in crude oil prices, the inflation expectations and term premiums included earlier were quickly erased. By the end of June, the two had fallen back to the level before the outbreak of the conflict. However, supported by the Federal Reserve's “Higher for Longer” hawkish stance and no economic landing expectations, short-term real interest rates are expected to remain high, becoming the core undertone supporting the final rise in US bond yields in the first half of the year.
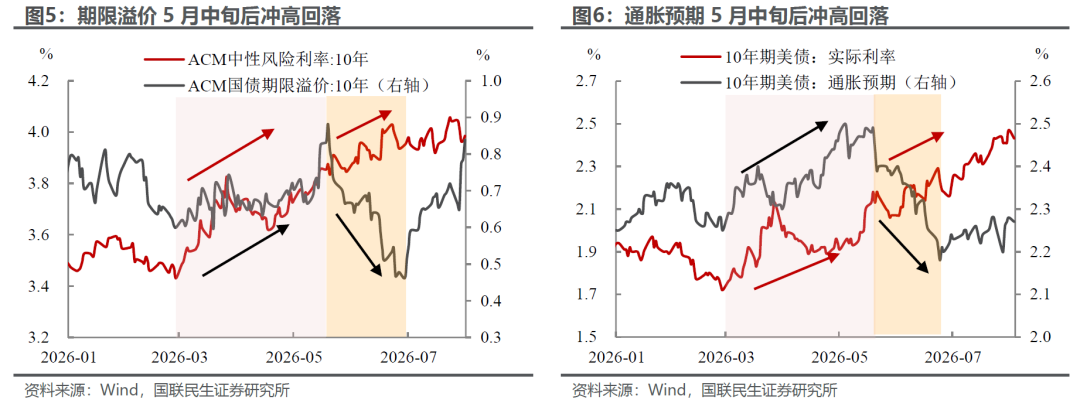
In summary, the US bond market in the first half of the year was more of a “policy interest rate repricing” market driven by fundamentals. That is, the market revolved more around “economic resilience - delay in interest rate cuts”, which is a typical fundamental-driven logic. At this stage, although inflation expectations were repeated due to geopolitics, the overall anchoring was good, and the imbalance between supply and demand squeezing term premiums has not yet become market-leading. The yield curve is mainly interpreted as a “bear flat” pattern where short-term interest rates catch up with the long-term.
2. The core conflict in the US bond market in the second half of the year?
However, after entering July, there was a certain shift in the upward logic of US bond interest rates, which was reflected in the sharpening of the yield curve — term premiums took over expected short-term real interest rates, and once again became the core driving force driving long-term US bond yields to soar.
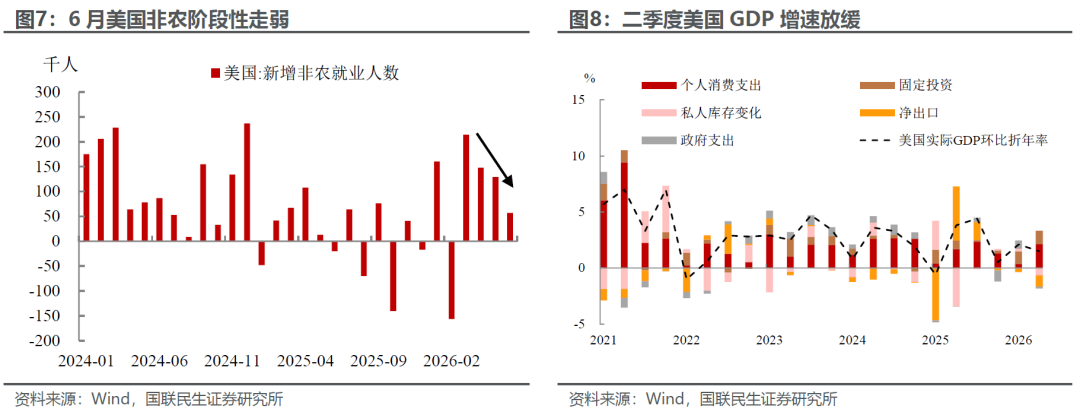
First, slowing fundamentals and the Federal Reserve's hesitation to raise interest rates have dampened the momentum of short-term real interest rate expectations. As macroeconomic indicators such as non-agricultural agriculture, inflation, and GDP showed signs of marginal weakening, and the Fed's prudence and hesitation in the policy interest rate path, the market's momentum for further upward expectations of the Fed's interest rate hike waned. Since July, the driving effect of short-term real interest rates on long-term yields is expected to decrease markedly, and overall action will slow down.
However, long-term nominal interest rates rose unilaterally, driven by term premiums, and the yield curve accelerated steeply. As can be seen, interest rates on 10-year US bonds have risen by about 30 bps since July, almost all contributed by maturity premiums, while risk-neutral interest rates have remained basically unchanged. At the same time, although forward inflation expectations were generally low throughout July, they showed signs of a slow upward trend. In particular, after the FOMC interest rate meeting was held at the end of July, the rise in inflation expectations and repricing seemed to accelerate.
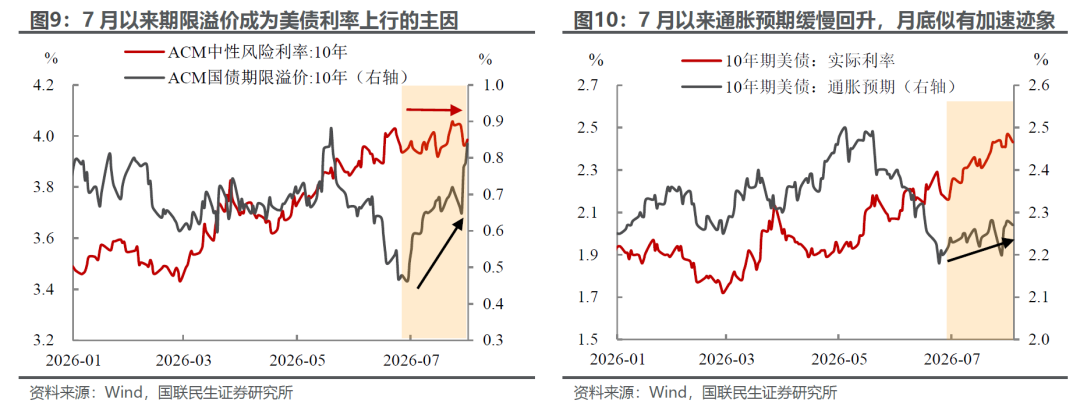
Specifically, we believe that the accelerated rise in term premiums and signs of rising inflation expectations at this stage are mainly due to fiscal concerns, mismatch pressure between supply and demand, and concentrated outbursts of policy uncertainty. Currently, the market does not seem to have fully priced these risks:
First, on the fiscal side, deficit pressure continues to expand, systemically elevating the long-term supply center in the medium to long term. Market discussions on fiscal deficits and tariff policies in the first half of the year were once taken away by geopolitical risks, but with the recent advance of the tariff refund process and the midterm elections approaching, concerns about fiscal pressure returned to the market.
In terms of revenue, IEEPA tariff refunds were paid centrally, creating a direct financial squeeze on the financial side. Since the relevant tariffs previously levied based on the International Emergency Economic Powers Act (IEEPA) were judicially determined to be illegal, the government needed to refund a total of about 166 billion US dollars in customs payments. Since tax rebates began this fiscal year, the Ministry of Finance has completed refunds of 81 billion US dollars (mainly in May-June), and nearly half of the funds are still awaiting payment. We estimate that tax rebates are expected to boost the deficit rate by about 0.6 percentage points, significantly tightening the financial chain in the short term.
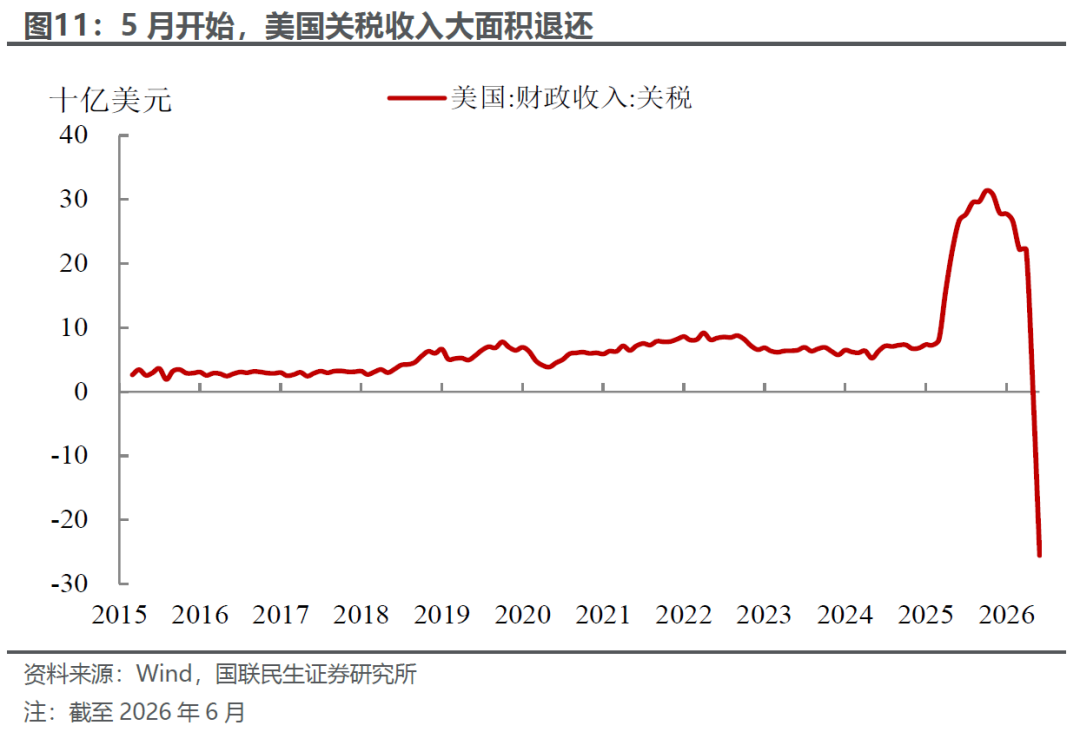
However, alternative tariff provisions make it difficult to completely fill the tax gap, and the medium- to long-term fiscal pressure to issue debt is difficult to resolve. Although the government attempted to use section 301 of the 1974 Trade Act to replace section 122 for a policy transition, it is still difficult to make up for the huge tax losses caused by tax refunds:
In the short term, a sharp contraction in tariff revenue directly boosted the deficit during the year. According to Yale Budget Lab's forecast, the new US tariff revenue in fiscal 2026 may fall to about 80 billion US dollars, less than half of the level of fiscal year 2025 (190 billion US dollars). Considering the impact of tax rebates, this means that the single factor of the decline in tariff revenue alone will drive the 2026 deficit rate to increase by an additional 0.3-0.4 percentage points compared to the 2025 fiscal year (5.8%).
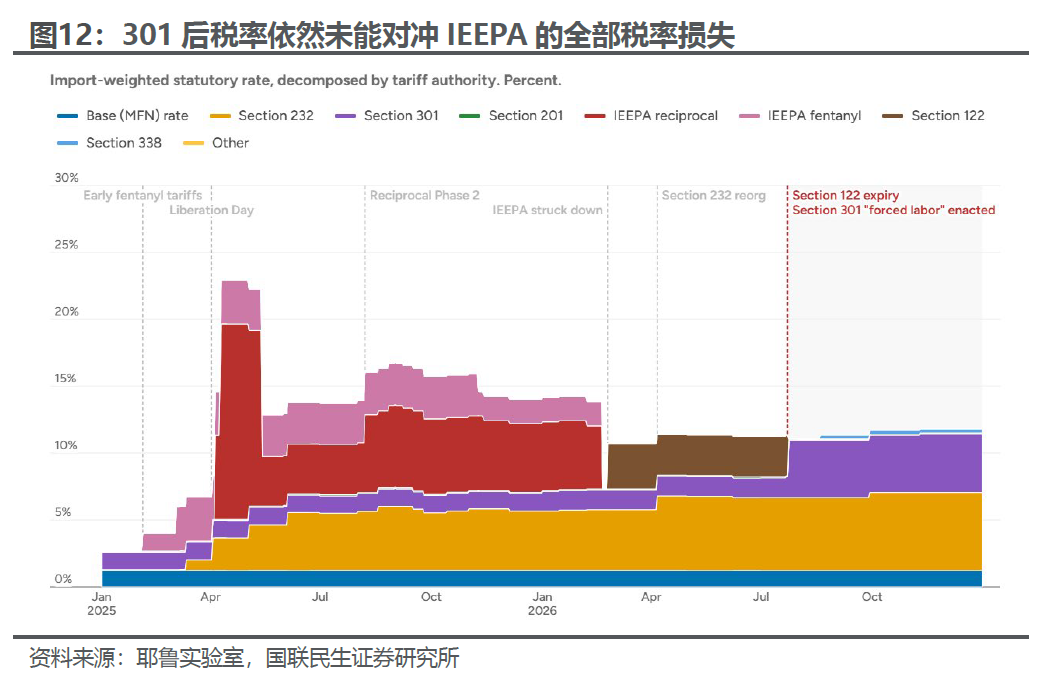
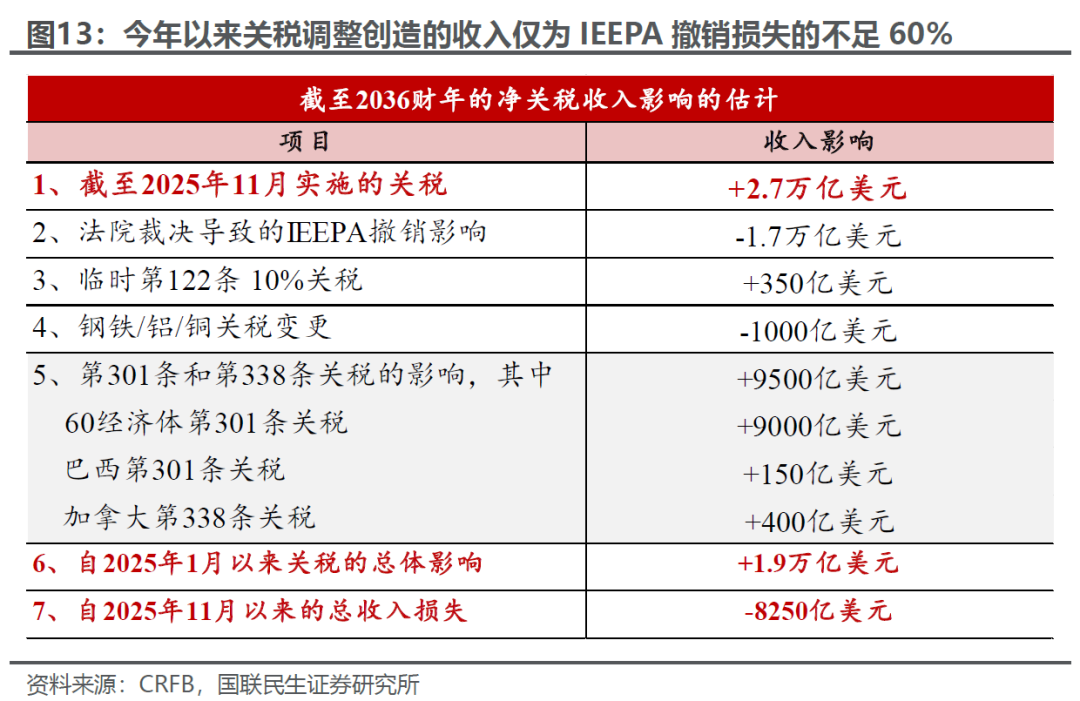
In the long run, the tax coverage rate of the new regulations is limited, and the structural gap will force supply to remain high for a long time. The amount of tax that can be created by the current 301 and 338 provisions can only cover less than 60% of the revenue from the previous equal tariff stage. According to CRFB estimates, the IEEPA ruling will accumulate about 1.7 trillion US dollars in tax revenue by fiscal year 2036, while the new regulations are expected to increase only 950 billion US dollars, filling the gap by less than 60%. This long-term structural gap will force the Treasury to continue to expand the scale of treasury bond issuance, driving the long-term supply of long-term US bonds to remain high.
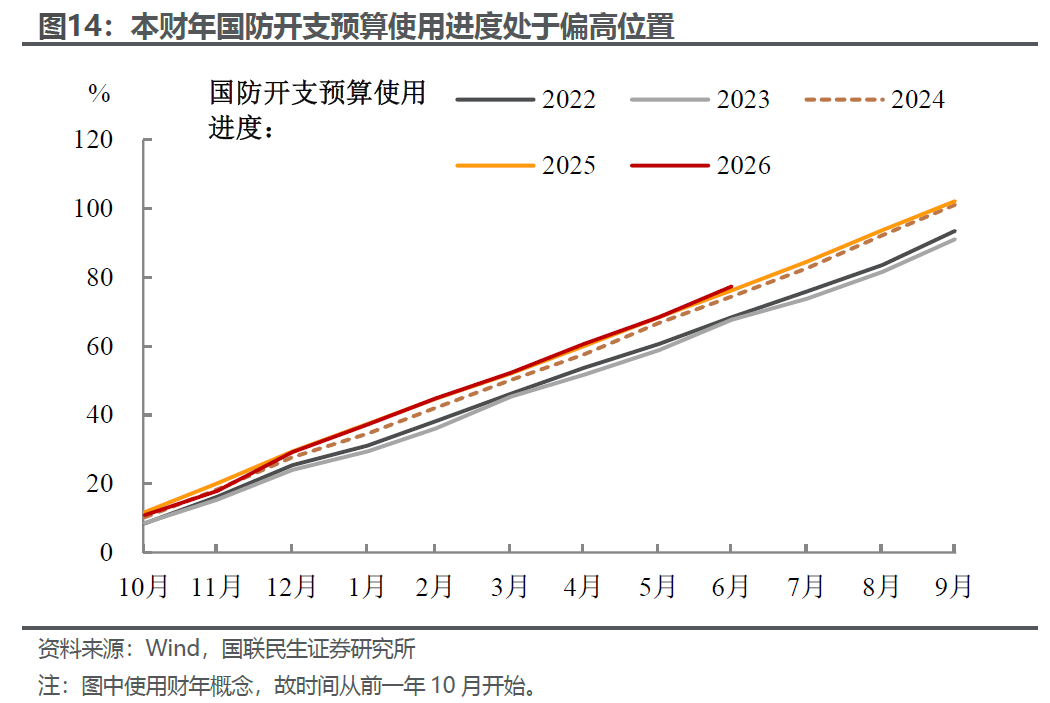
Meanwhile, in terms of spending, the heightened geographical conflict has triggered a passive expansion of military spending, constituting an additional rigid pressure on the fiscal deficit. This poses a severe test to the Trump administration's ability to balance its finances. The US defense budget for the 2026 fiscal year was approximately US$876.8 billion, and as of June, the current fiscal year had reached 678.7 billion US dollars (nearly 80%). If the subsequent US-Iran conflict does not cool down in time, the protracted geographical game will force a rigid expansion of defense spending and overseas military aid budgets. This will not only reduce the room for maneuver for subsequent fiscal stimulus, but will also directly translate into additional increases in treasury bond issuance, exacerbating the imbalance between long-term supply and demand for long-term treasury bonds.
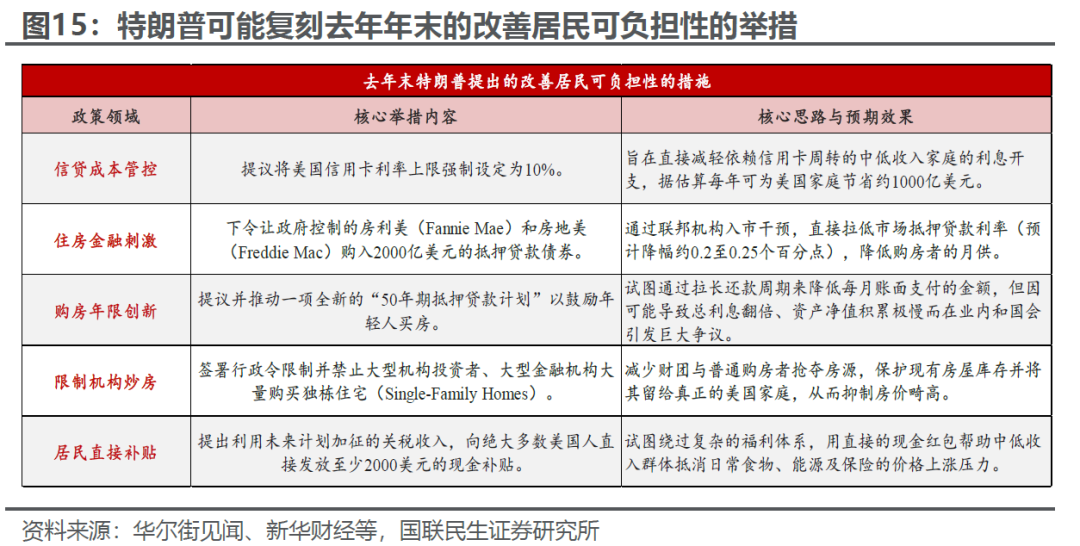
Furthermore, as the midterm elections approach, the Trump administration's political demands to ease residents' affordability are becoming more urgent. In order to secure a basic market for middle- and low-income voters, referring to the Trump administration's policy ideas last year, it may directly ease the cost of living pressure on the residential sector by setting a credit card interest rate cap (such as the 10% upper limit proposal), issuing targeted livelihood and consumption subsidies, and using administrative and quasi-fiscal measures to guide mortgage interest rates downward.
Although there is still a time lag between policy framework planning and the implementation of legal procedures, and the probability that the relevant measures will be fully implemented during the year, their marginal impact on the financial market may appear ahead of time: the market's expectations for a second fiscal easing and deficit expansion may further heat up supply premiums and central inflation expectations for US bonds, thus putting continuous upward pressure on long-term US bond interest rates.
Second, the long-term supply and demand pattern has deteriorated to a certain extent, which is forcing term premiums to rise. Currently, the total size of US treasury bonds has broken through the 39 trillion US dollar mark, and the share of treasury bonds in GDP remains at an all-time high of 120%. However, while the Treasury continues to release the “supply torrent” of US debt, the marginal carrying capacity of the demand side has clearly weakened.
First, the policy direction of Walsh's downsizing has strengthened expectations of medium- to long-term liquidity tightening. Walsh's takeover sent a clear signal — the Federal Reserve will strictly abide by monetary policy discipline and balance sheet restrictions, and it will be difficult to return to the previous “flood of water” extreme easing, which means that the central bank's underpinning function for long-term US debt is gradually weakening.
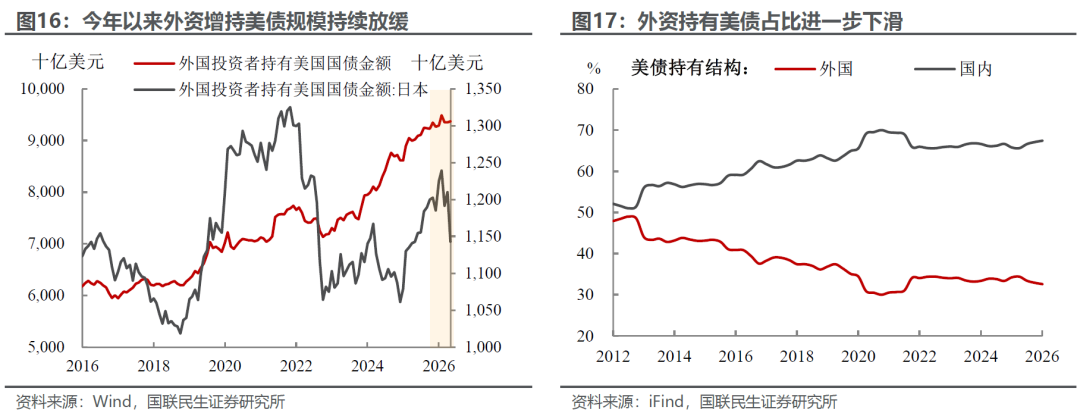
Second, the marginal exit of core buyers such as overseas official agencies has further intensified the pressure of long-term mismatches in the market. Since this year, there has been a marked slowdown in the allocation of foreign capital to US bonds. Among them, the Bank of Japan and local institutions, which are the largest overseas holders of US debt, have sold off in particular — from January to May of this year alone, Japan's net sell-off of US debt reached 80 billion US dollars. The characteristics of the imbalance between supply and demand in the US bond market are becoming more prominent, forcing long-term US bonds to raise maturity premiums again in order to clear excess long-term supply and attract marginal buyers in the private sector.
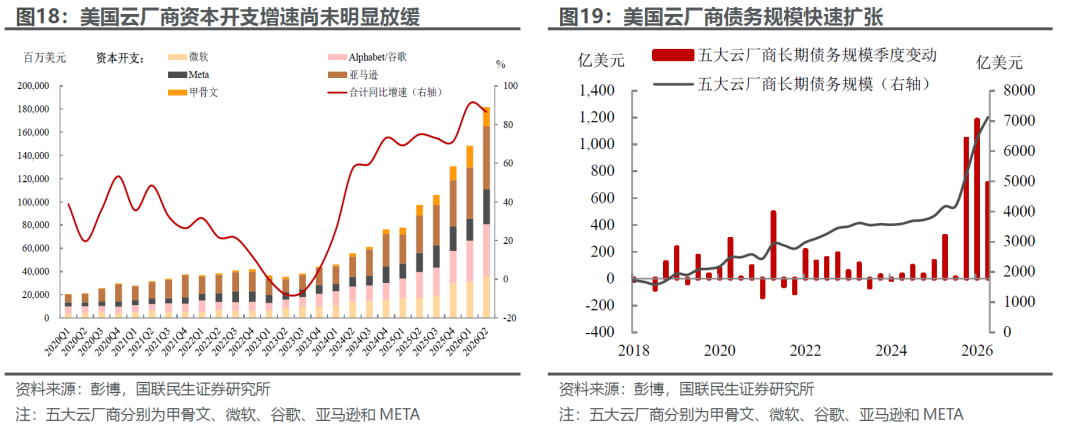
Third, the wave of AI capital expenditure is increasing the supply of investment-grade corporate bonds, which has had a certain “crowding out effect” on long-term US debt allocations. In order to raise huge capital expenses for AI computing power infrastructure during the year, major cloud vendors drastically increased the scale of issuing high-rated corporate bonds. As of 2026Q2, the five major cloud vendors (including Microsoft, Google, META, Amazon, and Oracle) reached 180 billion US dollars in capital expenditure for the quarter (an increase of about 90% year over year), and long-term debt reached 700 billion US dollars (almost double that of the beginning of 2025).
The “substitution effect” of high-rated corporate bonds forced US bonds to raise maturity premiums to maintain their attractiveness. This wave of supply of high-quality, high-yield corporate bonds directly crowds out institutional allocation funds (such as insurance, pension, and asset management agencies) originally deposited in long-term treasury bonds. Against the backdrop of market makers and institutions' balance sheets already tightening, treasury bonds must provide higher yield compensation (that is, higher maturity premiums) in order to clear the “competition for capital pools” with high-rated corporate bonds. This marginally further exacerbates the upward trend in long-term US bond yields.
Finally, Walsh's “vague framework” and “just say don't do” policy statements are repricing the market's long-term inflation risk. In particular, after the FOMC interest rate meeting came to fruition in July, although Walsh strongly emphasized his hawkish determination to fight inflation, this “tough statement and lagging behind in action” policy diverged, in turn, exacerbated the financial market's policy trust deficit.
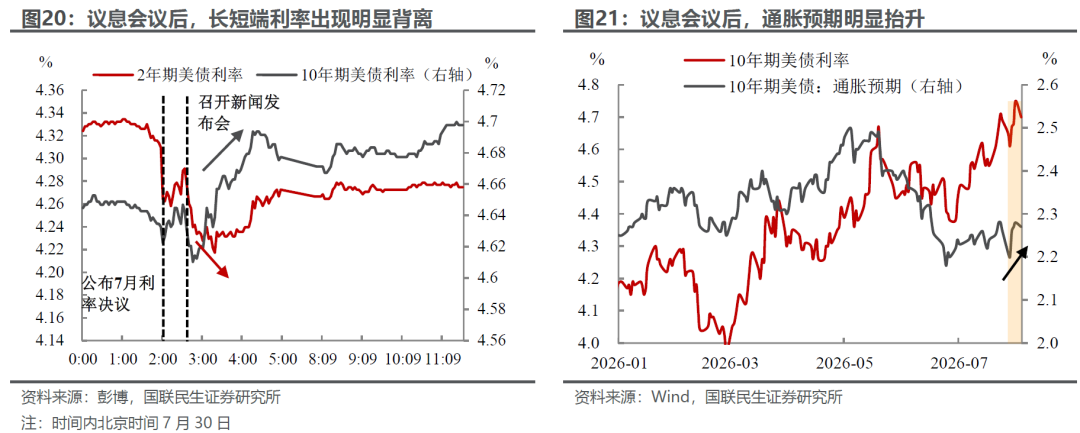
Markets are beginning to be deeply concerned that the Federal Reserve's “actions are falling behind the curve” in dealing with potential supply-side shocks and secondary inflation. The vagueness of this policy path and the disconnect between execution risks loosening medium- to long-term inflation anchoring, which in turn pushes investors to demand higher inflation risk premiums. After the press conference of the July interest rate meeting, short-term interest rates declined markedly, but under the influence of inflation expectations, long-term interest rates rose further to 4.7%.
3. The major dimensions of the US debt crisis that need to be closely observed
In summary, we believe that the steeper yield curve will form the core trading line of the US bond market in the second half of the year. The US debt pricing framework is undergoing structural restructuring under multiple pressures, such as the expansion of fiscal deficits forcing debt issuance pressure, the “capital crowding out effect” of the AI giant's financing wave, and the risk of rising long-term inflation. This also means that simply relying on loose expectations may not be able to suppress high long-term interest rates in one direction, and that the dominance of long-term US bonds is shifting rapidly to maturity premiums and the fundamentals of supply and demand.
Looking ahead to the second half of the year, the breakdown and rebalancing of US debt trends should focus on tracking the following core indicators:
1) Fundamentals and actual interest rates (short-term anchors): If macroeconomic and inflation data can show a continuous slowing trend, it is expected that short-term real interest rates and policy interest rate expectations will actually be lowered;
2) Tariff hedging and fiscal gaps (fiscal and supply-side): In terms of revenue, will the Trump administration launch new tariff measures (using tariff revenue to supplement the fiscal gap) in the second half of the year to marginally ease the fiscal debt pressure caused by tax rebates; in terms of spending, observe the rigid expansion of defense military spending caused by heightened geographical conflicts, and the secondary squeeze on fiscal spending by low- and middle-income voters with livelihood subsidies (such as affordability measures). If rigid expansion on the spending side crowds out space for fiscal maneuver, it will directly force the US debt issuance flood peak to remain high, exacerbating the long-term imbalance between supply and demand;
3) Progress in reducing foreign holdings and AI crowding out effects (demand side): Focus on tracking the marginal trend of overseas official institutions represented by Japan over a long period of time. As the pressure to depreciate the yen slows down, observe whether the Bank of Japan is gradually slowing down the pace of reduction in US debt holdings to reduce the upward pressure on maturity premiums; at the same time, observe the “crowding out effect” of long-term high-rated corporate bonds issued by tech giants (Hyperscalers) for AI computing power infrastructure on allocating funds to US bonds.
4) Progress of implementation of the Walsh Reform Group (policy uncertainty expectations): Can the reform working group set up by the new Federal Reserve Chairman Walsh (involving communication mechanisms, balance sheets and inflation frameworks, etc.) introduce an implementation plan as soon as possible to ease the Fed's deep difficulties in balancing “downsizing discipline, liquidity management, and political independence” at the institutional level, and fix the market's term premium and inflation risk expectations.
Risk warning: AI demand has clearly slowed; US inflation stickiness exceeds expectations; escalating geopolitical conflict and a sharp rise in oil prices: US fiscal policy has exceeded expectations.