
- PRICING
- LIVE QUOTES
- LEARN
- HELP


EN
Is ERAMET (ENXTPA:ERA) Undervalued On Mixed Production Results And Confirmed Guidance?
ERAMET (ENXTPA:ERA) has drawn fresh investor attention after reporting mixed second quarter and first half 2026 production figures, confirming full year guidance and outlining progress on manganese projects in Gabon.
See our latest analysis for ERAMET.
ERAMET's recent production update and confirmed guidance come against a weak backdrop for the stock, with the share price down 26.29% over 90 days and the 1 year total shareholder return declining 9.11%. However, short term share price momentum has improved with a 4.51% 7 day gain.
If you are assessing ERAMET within the broader materials space, this could be a good moment to scan for other rare earth and critical metals opportunities using the 29 best rare earth metal stocks.
After ERAMET's sharp pullback and recent rebound, the stock now trades well below both analyst price targets and some fair value estimates. Is that discount justified by current losses, or has sentiment moved too far?
Preferred Price-to-Sales of 0.4x: Is it justified?
On the latest close at €43.12, ERAMET screens as inexpensive on several valuation checks, particularly its price-to-sales ratio of 0.4x versus peers and the wider metals and mining industry. That low multiple sits alongside a sizeable gap to some fair value estimates using discounted cash flow models and a meaningful discount to analyst price targets.
The P/S multiple looks at how much investors are paying for each euro of ERAMET's revenue, which matters for a company that is currently loss making. With reported revenue of €2.93b and a market cap of about €1.23b, the 0.4x reading is at the lower end of the sector range described in the checks above.
Several statements suggest the market is pricing ERAMET below what both peers and some models imply. The stock is described as trading at good value compared to its industry, to peers, and to an estimated fair price-to-sales ratio of 2.3x. For investors, that raises a clear question. Is the discount mainly reflecting current losses and balance sheet pressure, or is it more than those factors justify based on the growth that is forecast?
Compared with the European metals and mining industry average P/S of 1.1x and a peer average of 1.4x, ERAMET's 0.4x stands out as much lower. The fair ratio estimate of 2.3x points to a level the market could move towards if sentiment and fundamentals line up more closely with those assumptions.
Explore the SWS fair ratio for ERAMET
Result: Price-to-sales of 0.4x (UNDERVALUED)
However, ERAMET still faces risks from its loss making position and its exposure to manganese, nickel and lithium prices, which could keep pressure on sentiment.
Find out about the key risks to this ERAMET narrative.
Another view on ERAMET's value
Alongside the low 0.4x P/S ratio, our DCF model suggests ERAMET could also be undervalued on a cash flow basis. The current share price of €43.12 sits well below an estimated future cash flow value of €138.54. Does this second lens simply echo the multiple based signal, or is it too optimistic for a cyclical miner?
Look into how the SWS DCF model arrives at its fair value.
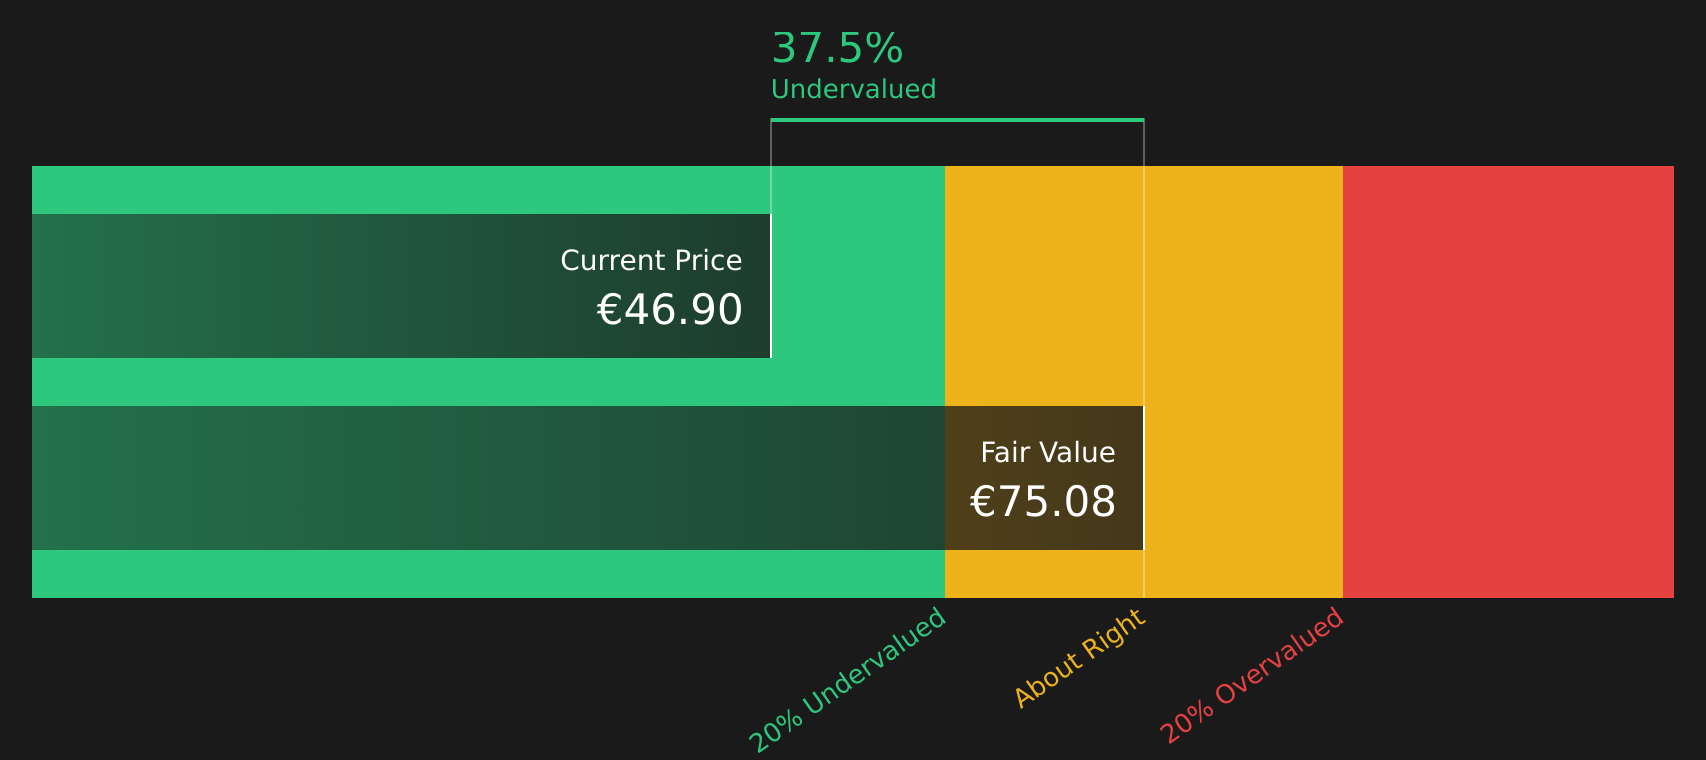
Simply Wall St performs a discounted cash flow (DCF) on every stock in the world every day (check out ERAMET for example). We show the entire calculation in full. You can track the result in your watchlist or portfolio and be alerted when this changes, or use our stock screener to discover 254 high quality undervalued stocks. If you save a screener we even alert you when new companies match - so you never miss a potential opportunity.
Next Steps
Given the mixed signals around ERAMET, it makes sense to look past headlines and review the underlying data yourself. Act promptly, consider both the risks and the potential upsides, and see how your view aligns with the 4 key rewards and 1 important warning sign.
Looking for more investment ideas beyond ERAMET?
If you stop with ERAMET, you could miss other opportunities that fit your style. Use the Simply Wall St screener to quickly surface ideas that match your priorities.
- Target potential bargains by scanning companies that combine valuation and quality through the 254 high quality undervalued stocks.
- Strengthen the core of your portfolio by focusing on financially healthy businesses using the solid balance sheet and fundamentals stocks screener (414 results).
- Get ahead of the crowd by uncovering under followed opportunities with the screener containing 538 high quality undiscovered gems.
This article by Simply Wall St is general in nature. We provide commentary based on historical data and analyst forecasts only using an unbiased methodology and our articles are not intended to be financial advice. It does not constitute a recommendation to buy or sell any stock, and does not take account of your objectives, or your financial situation. We aim to bring you long-term focused analysis driven by fundamental data. Note that our analysis may not factor in the latest price-sensitive company announcements or qualitative material. Simply Wall St has no position in any stocks mentioned.
Have feedback on this article? Concerned about the content? Get in touch with us directly. Alternatively, email editorial-team@simplywallst.com