
- PRICING
- LIVE QUOTES
- LEARN
- HELP


EN
Mohawk Industries (MHK) Could Be 2% Overvalued Following Q2 Earnings And CEO Change
Q2 earnings and leadership change reshape Mohawk Industries story
Mohawk Industries (MHK) is back in focus after higher than expected second quarter sales and net income, rising margins across all segments, continued share repurchases, and the appointment of Paul De Cock as CEO.
These updates give you fresh information on how the company is handling profitability, capital returns, and leadership succession. All of these factors can matter when you think about Mohawk Industries as a long term holding.
See our latest analysis for Mohawk Industries.
The recent earnings beat, share repurchases totaling US$206.4 million since mid 2025, and the CEO transition appear to sit alongside a 90 day share price return of 23.19% and a 1 year total shareholder return of 5.50%. Together, these factors suggest improving momentum for Mohawk Industries after a weaker 5 year total shareholder return that declined 38.84%.
If Mohawk Industries has you rethinking where the next opportunity might come from, this can be a useful time to scan 18 top founder-led companies
After Mohawk Industries’ quick rebound and recent margin progress, the trade off becomes clear. Does it make sense to accept today’s price after the run, or wait and hope valuation offers a cleaner entry?
Most Popular Narrative: 2% Overvalued
The most followed narrative currently places Mohawk Industries’ fair value at $120.47, slightly below the last close of $123.10. This points to only a small valuation gap and keeps attention squarely on how margins and leadership execution unfold.
Strategic investments in sustainability including product circularity, material optimization, and green energy are positioning Mohawk to capture premium pricing and expanded margins as more customers seek environmentally friendly flooring solutions. Ongoing digital and operational transformation through technology upgrades, automation, and supply chain optimization is projected to improve operational efficiency and drive net margin enhancement over the long term.
Curious what has to happen for Mohawk Industries to justify that fair value? The narrative leans on slower top line progress, firmer margins, and a different future earnings multiple. The exact mix of growth, profitability, and discount rate assumptions may surprise you.
Result: Fair Value of $120.47 (OVERVALUED)
Have a read of the narrative in full and understand what's behind the forecasts.
However, the Mohawk Industries story can still shift if weaker flooring demand lingers or if cost pressures and pricing competition squeeze the margin outlook that supports today’s narrative.
Find out about the key risks to this Mohawk Industries narrative.
Another view on Mohawk Industries valuation
The analyst narrative points to Mohawk Industries trading about 2% above the US$120.47 fair value estimate. That frames MHK as slightly overvalued on those earnings and multiple assumptions.
Our DCF model tells a different story. On this view, MHK at US$123.10 sits below an estimated future cash flow value of US$148.27, which implies the stock screens as undervalued on cash generation rather than earnings multiples. Which lens do you think should matter more for your thesis?
Look into how the SWS DCF model arrives at its fair value.
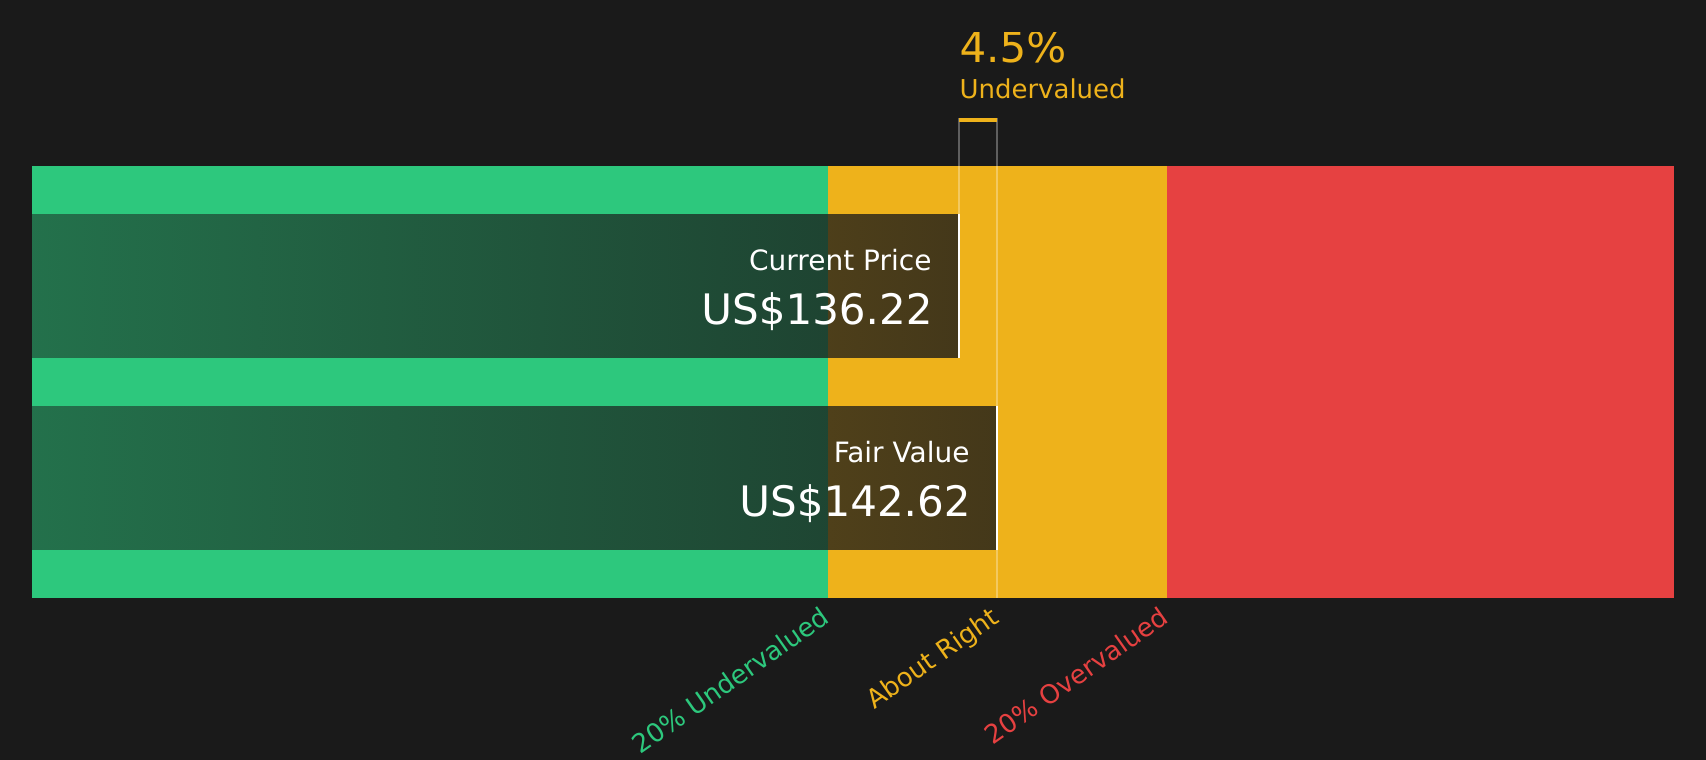
Simply Wall St performs a discounted cash flow (DCF) on every stock in the world every day (check out Mohawk Industries for example). We show the entire calculation in full. You can track the result in your watchlist or portfolio and be alerted when this changes, or use our stock screener to discover 55 high quality undervalued stocks. If you save a screener we even alert you when new companies match - so you never miss a potential opportunity.
Next Steps
With Mohawk Industries showing both optimism and concern in the recent updates, this is a good moment to move fast and weigh the full picture yourself using 2 key rewards and 2 important warning signs
Looking for more investment ideas beyond Mohawk Industries?
If you like how Mohawk Industries sharpened your thinking, do not stop here. Broader ideas can help you spread risk and spot opportunities you may have missed.
- Explore stronger return potential by scanning companies that combine quality fundamentals with attractive prices using the 55 high quality undervalued stocks.
- Enhance your income stream by reviewing stocks with higher yields that still aim for resilience through the 9 dividend fortresses.
- Limit your downside by focusing on businesses with steadier profiles and robust fundamentals through the 81 resilient stocks with low risk scores.
This article by Simply Wall St is general in nature. We provide commentary based on historical data and analyst forecasts only using an unbiased methodology and our articles are not intended to be financial advice. It does not constitute a recommendation to buy or sell any stock, and does not take account of your objectives, or your financial situation. We aim to bring you long-term focused analysis driven by fundamental data. Note that our analysis may not factor in the latest price-sensitive company announcements or qualitative material. Simply Wall St has no position in any stocks mentioned.
Have feedback on this article? Concerned about the content? Get in touch with us directly. Alternatively, email editorial-team@simplywallst.com