- PRICING
- LIVE QUOTES
- LEARN
- HELP


EN
The increase exceeds the Internet bubble period! High beta momentum stocks plummeted 35% to repeat history, BTIG warns of the risk of a “boom-bust” cycle
The Zhitong Finance App learned that the independent research institute BTIG recently released a report saying that the trend of the high-beta momentum factor (High-Beta Momentum, code SPMO) is increasingly showing a typical pattern of past boom-bust cycles, even though the agency clearly stated that “it has not yet been characterized as a bubble.”
In a strategy report entitled “Anatomy of a Bubble,” BTIG technical strategist Jonathan Klinsky wrote that the agency “does not regard high beta momentum as a bubble,” but recently the price behavior of this factor has begun to “resemble” historical speculation cycles.
According to BTIG, the high-beta momentum basket recorded a cumulative increase of 3,500% from a low in 2009 to June 2026. This increase has surpassed the 3092% increase recorded by the Nasdaq Composite Index during the peak of the internet bubble from 1982 to 2000 over 18 years.
Furthermore, in the 32 months ending June 2026, the cumulative change in the high beta momentum factor was 373%, while the Nasdaq Composite Index rose 225% in the 32 months before its peak in 2000, and the Nasdaq 100 Index rose 345% during the same period.
Klinsky said, “It is clearly too early to say whether this factor and related stock groups will end like the bubble of the past. However, as we showed later in the report, many aspects of recent price behavior are indeed highly consistent with the characteristics of previous similar cycles.”
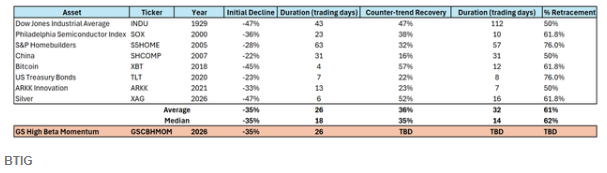
The recent decline has also followed the pattern of history. BTIG reviewed eight classic boom-bust peak examples, including the Dow Jones Industrial Average (DJI) in 1929, the Philadelphia Semiconductor Index (SOX) in 2000, the Home Builders Sector (XHB) in 2005, China Related Indices (MCHI, FXI) in 2007, Bitcoin (BTC-USD) in 2018, bonds in 2020, ARK Innovation ETF (ARKK) in 2021, and Silver (SLV) in 2026. The study found that during the initial phase of decline after these tops were formed, the average decline was 35%, and the average duration was 26 trading days.
However, the high beta momentum factor in this round fell by 35% in just 26 trading days from a high on June 22 to a low on July 29, which is exactly in line with the historical average.
“It's kind of incredible.” Klinsky wrote.
BTIG further indicated that in the historical case described above, the median rebound after the initial decline was 35%, and the rebound period was about 14 trading days. If this trend repeats this pattern, it means that momentum stocks and the semiconductor sector are expected to experience a tactical technical rebound and may retest the 50-day EMA in mid-August.
However, BTIG also warned that if market conditions continue to deteriorate, it is inappropriate to fall in love with the war. Regarding the semiconductor and artificial intelligence sector, the agency believes that “it is clearly too early to assert that the cycle is over,” but notes that the Philadelphia Semiconductor Index has experienced a 29% retracement in about a month, then rebounded 13%.
Seasonal factors may also complicate overall market trends. BTIG pointed out that since 2010, August was the worst performing month for weighting indices (RSP) such as the S&P 500, with an average decline of 0.95%, while September was the second-best month.
Interest rates remain the biggest uncertain variable. BTIG said that if the 30-year US Treasury yield (US30Y) rises rapidly, it will be a headwind for the overall market, and the “speed” of rising yields is more critical than the “absolute level.”