
- PRICING
- LIVE QUOTES
- LEARN
- HELP


EN
Top European Dividend Stocks For July 2026
As European markets navigate a landscape marked by robust corporate earnings and heightened geopolitical tensions, investors are eyeing dividend stocks as a potential source of stability amid fluctuating oil prices and economic uncertainties. In this environment, selecting dividend stocks with strong financial health and consistent payout histories can offer investors a measure of resilience against market volatility.
Top 10 Dividend Stocks In Europe
| Name | Dividend Yield | Dividend Rating |
| Zurich Insurance Group (SWX:ZURN) | 4.06% | ★★★★★★ |
| Teleperformance (ENXTPA:TEP) | 7.38% | ★★★★★★ |
| Telekom Austria (WBAG:TKA) | 4.17% | ★★★★★★ |
| Swiss Re (SWX:SREN) | 4.79% | ★★★★★★ |
| Rubis (ENXTPA:RUI) | 6.18% | ★★★★★★ |
| Naturgy Energy Group (BME:NTGY) | 6.12% | ★★★★★☆ |
| Hannover Rück (XTRA:HNR1) | 4.95% | ★★★★★★ |
| EFG International (SWX:EFGN) | 4.04% | ★★★★★☆ |
| Edel SE KGaA (XTRA:EDL) | 6.33% | ★★★★★★ |
| Cembra Money Bank (SWX:CMBN) | 5.11% | ★★★★★★ |
Click here to see the full list of 195 stocks from our Top European Dividend Stocks screener.
Here we highlight a subset of our preferred stocks from the screener.
F.I.L.A. - Fabbrica Italiana Lapis ed Affini (BIT:FILA)
Simply Wall St Dividend Rating: ★★★★★☆
Overview: F.I.L.A. - Fabbrica Italiana Lapis ed Affini S.p.A. is a company that specializes in the production and distribution of art materials and writing instruments, with a market cap of approximately €480.45 million.
Operations: F.I.L.A. - Fabbrica Italiana Lapis ed Affini generates revenue primarily from its Office Supplies segment, which amounts to €566.33 million.
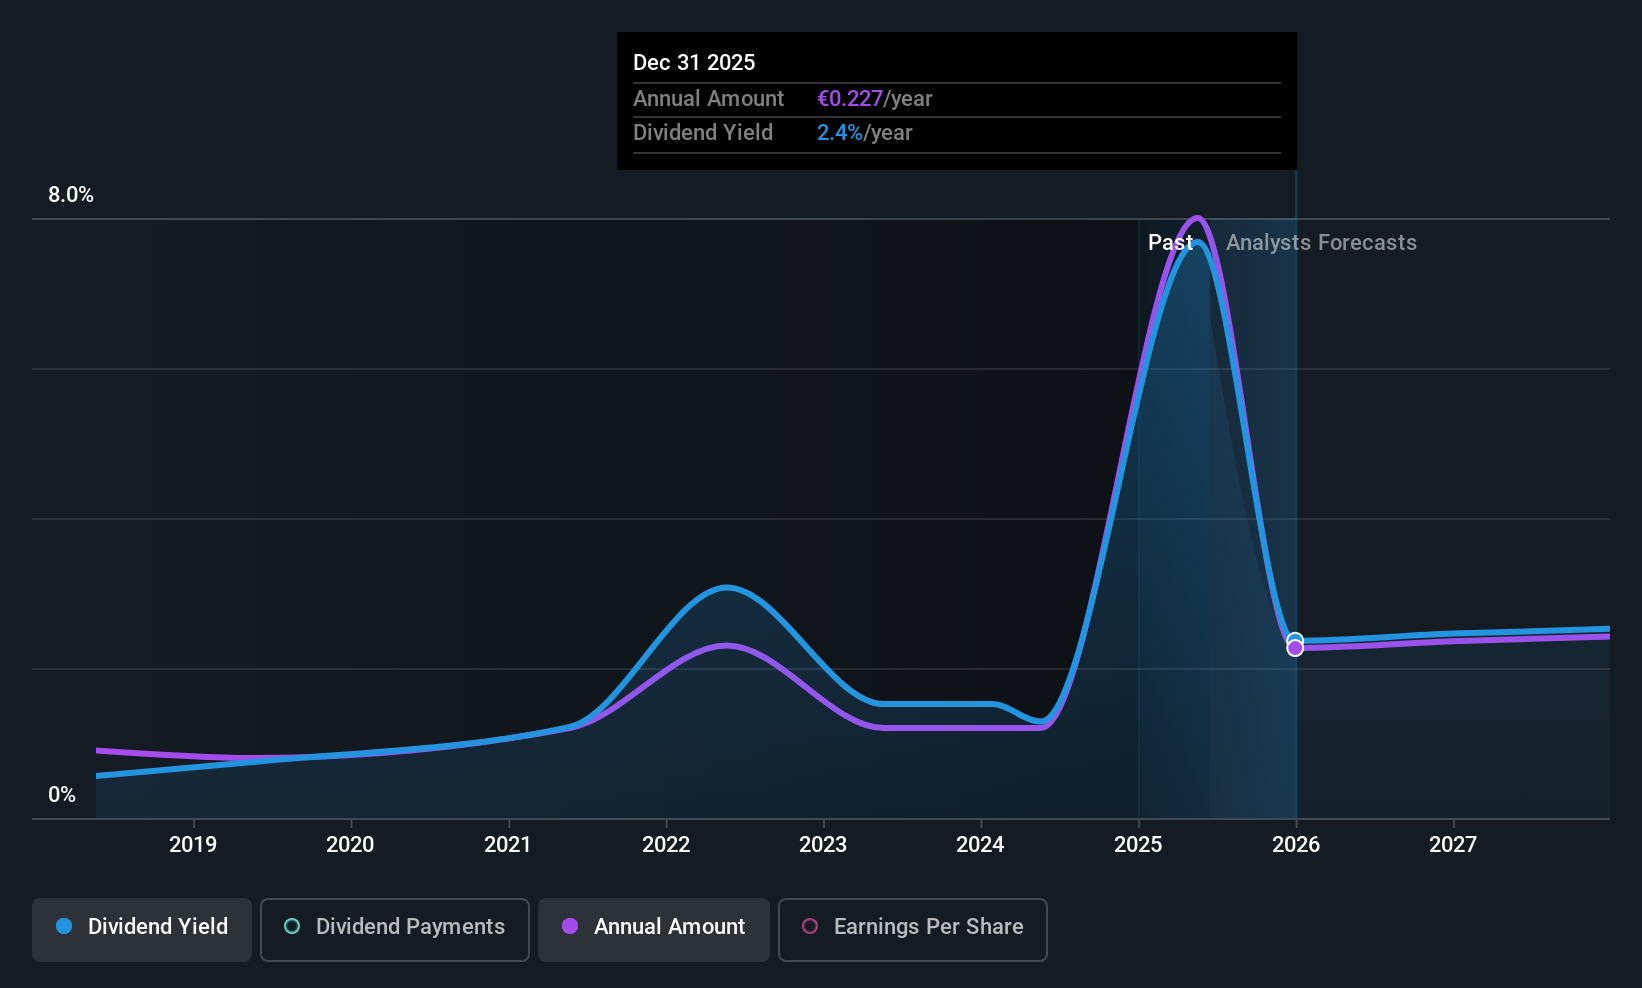
Dividend Yield: 8.5%
F.I.L.A. offers an attractive dividend yield of 8.46%, placing it among the top 25% of dividend payers in Italy, though its track record is unstable with past volatility and unreliability. Despite a high cash payout ratio of 87.7%, dividends are covered by earnings with a low payout ratio of 30.3%. Recent results show improved profitability, with net income rising to €2.14 million in Q1 2026 from a loss last year, supporting future dividend sustainability amidst confirmed revenue growth guidance for the year.
- Click here to discover the nuances of F.I.L.A. - Fabbrica Italiana Lapis ed Affini with our detailed analytical dividend report.
- Our comprehensive valuation report raises the possibility that F.I.L.A. - Fabbrica Italiana Lapis ed Affini is priced lower than what may be justified by its financials.
Acomo (ENXTAM:ACOMO)
Simply Wall St Dividend Rating: ★★★★☆☆
Overview: Acomo N.V. operates in sourcing, trading, processing, packaging, and distributing both conventional and organic food ingredients and solutions for the food and beverage industry across Europe, North America, and internationally with a market cap of €709.91 million.
Operations: Acomo N.V.'s revenue segments include Tea (€110.00 million), Edible Seeds (€205.37 million), Food Solutions (€26.57 million), Spices and Nuts (€557.21 million), and Organic Ingredients (€523.50 million).
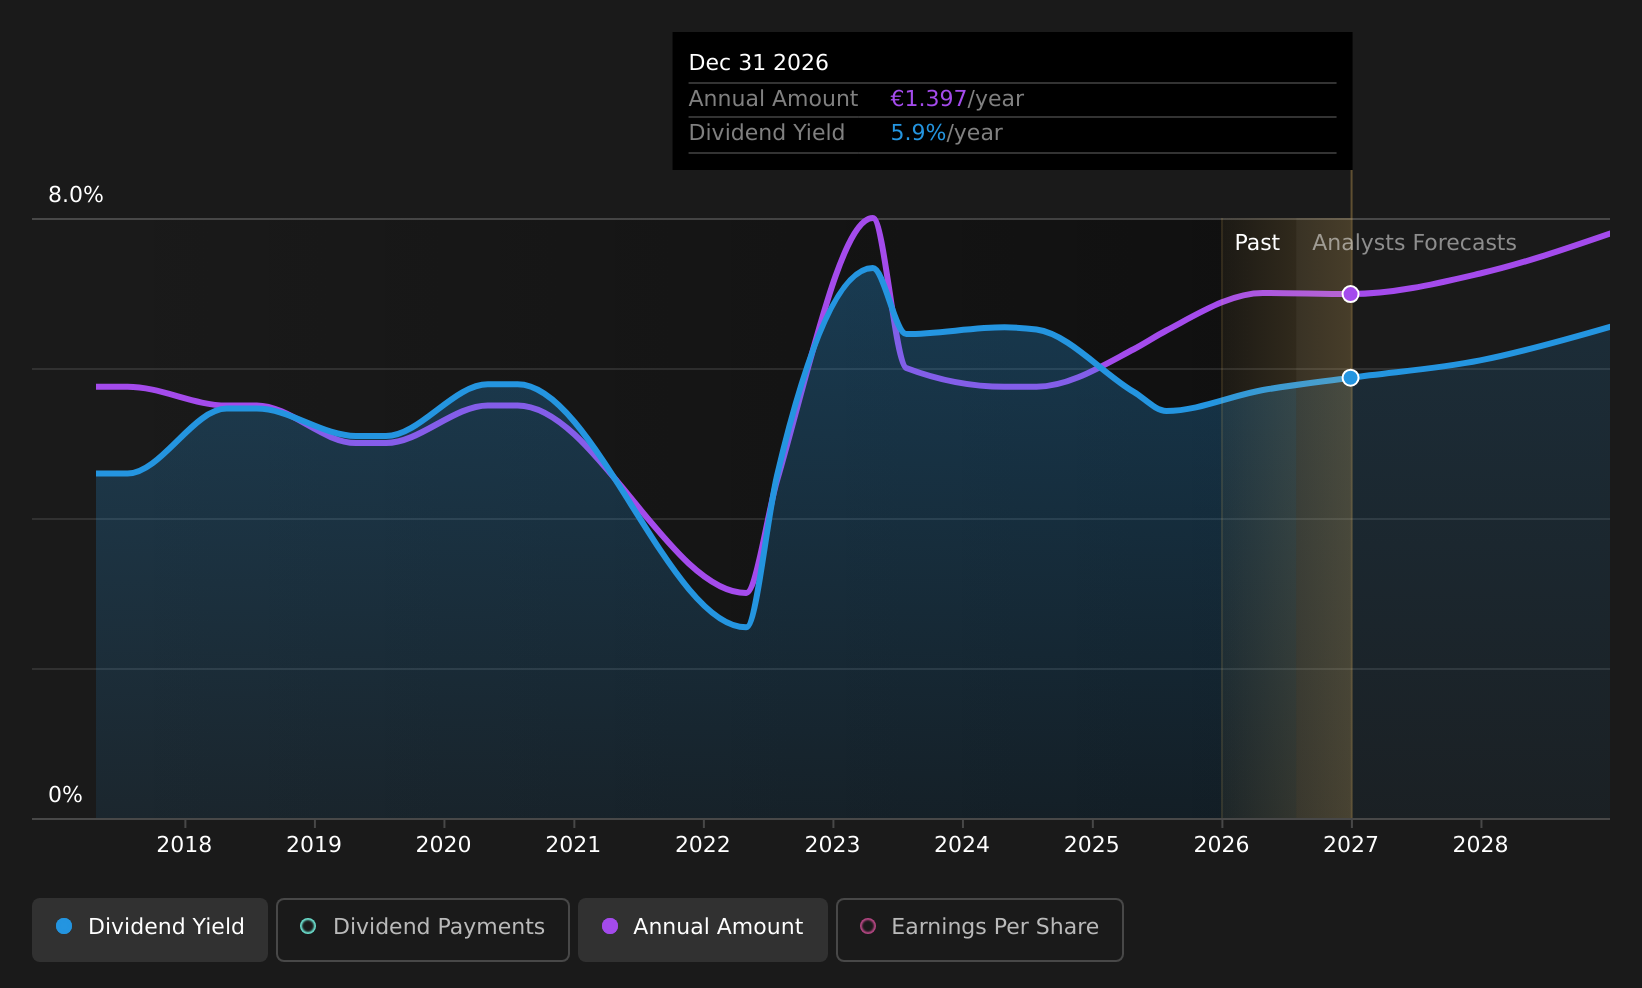
Dividend Yield: 5.9%
Acomo's dividend yield of 5.86% ranks it among the top 25% in the Dutch market, yet its history of volatile payments over the past decade raises concerns about reliability. Recent earnings show a decline, with net income at €27.82 million for H1 2026, down from €42.11 million last year, impacting dividend sustainability as payouts aren't covered by free cash flows or operating cash flow despite a reasonable payout ratio of 70.7%.
- Get an in-depth perspective on Acomo's performance by reading our dividend report here.
- The analysis detailed in our Acomo valuation report hints at an deflated share price compared to its estimated value.
Hacksaw (OM:HACK)
Simply Wall St Dividend Rating: ★★★★☆☆
Overview: Hacksaw AB (publ) is a B2B technology platform and game development company operating in Sweden and the Czech Republic, with a market cap of SEK21.46 billion.
Operations: Hacksaw AB (publ) generates revenue primarily from providing online casino solutions and related services to gaming operators, amounting to €224.01 million.
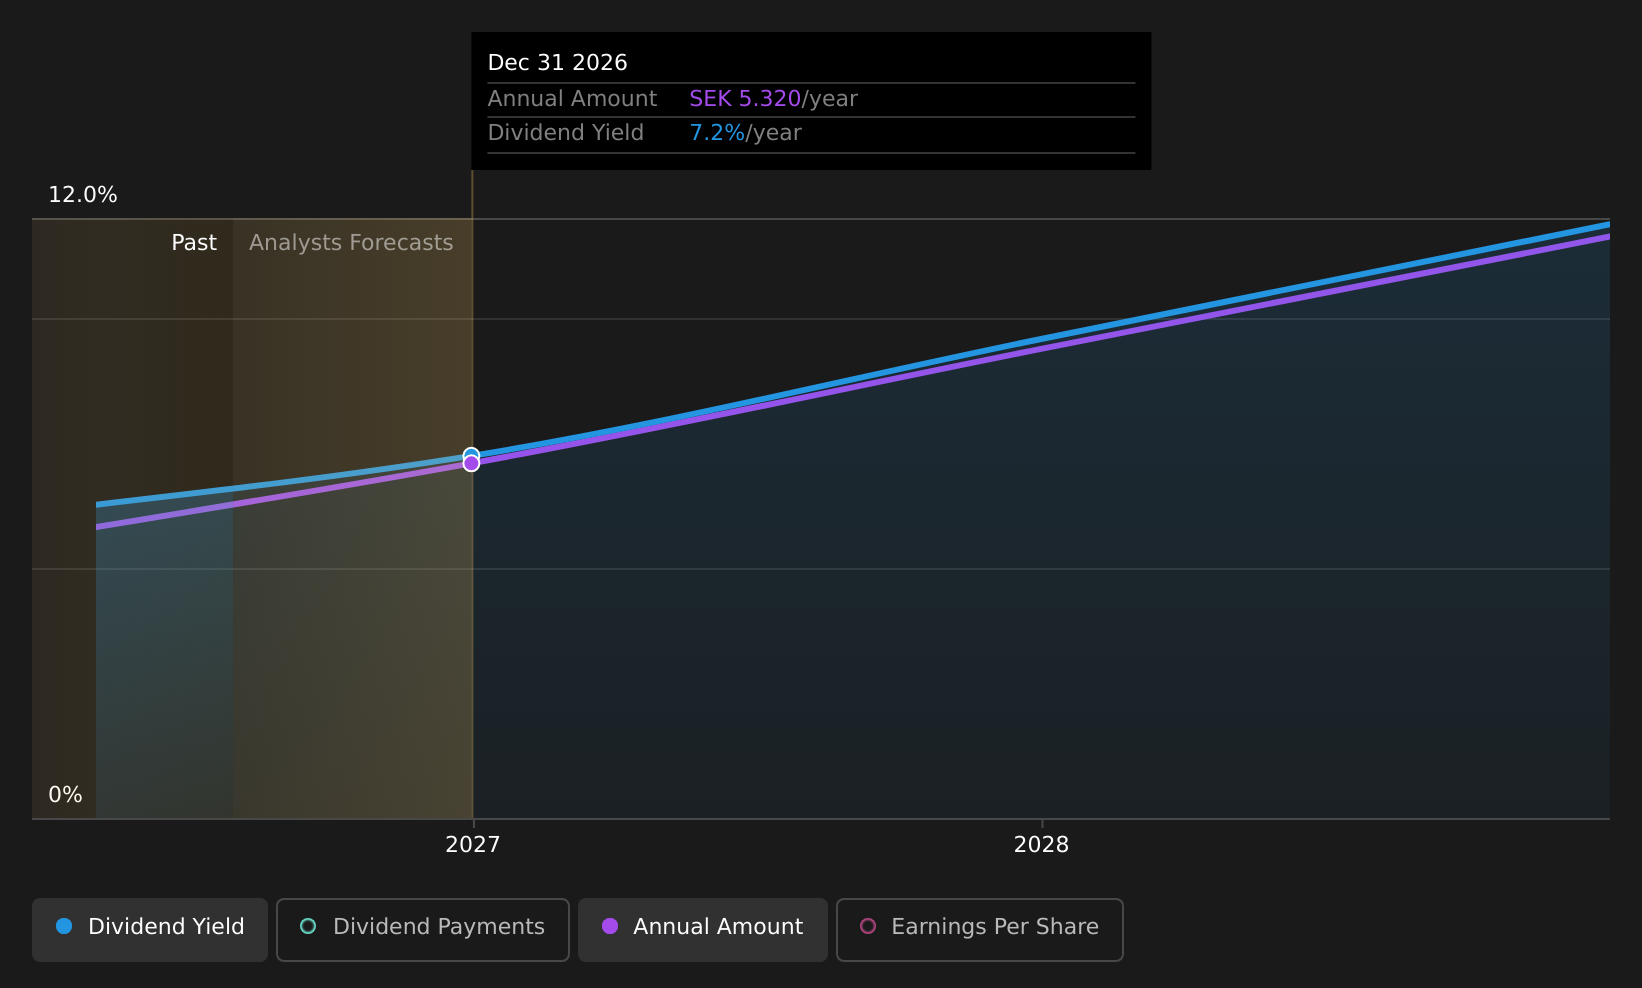
Dividend Yield: 5.9%
Hacksaw's recent earnings report shows robust growth, with net income reaching €91.23 million for H1 2026, up from €52.91 million last year, supporting its dividend sustainability. Despite being new to dividends, Hacksaw offers a competitive yield of 5.92%, placing it in the top 25% of Swedish dividend payers. Its payout ratios indicate dividends are covered by both earnings and cash flows, though it's too early to assess long-term reliability or growth trends.
- Unlock comprehensive insights into our analysis of Hacksaw stock in this dividend report.
- According our valuation report, there's an indication that Hacksaw's share price might be on the cheaper side.
Make It Happen
- Take a closer look at our Top European Dividend Stocks list of 195 companies by clicking here.
- Already own these companies? Bring clarity to your investment decisions by linking up your portfolio with Simply Wall St, where you can monitor all the vital signs of your stocks effortlessly.
- Take control of your financial future using Simply Wall St, offering free, in-depth knowledge of international markets to every investor.
Want To Explore Some Alternatives?
- Explore high-performing small cap companies that haven't yet garnered significant analyst attention.
- Fuel your portfolio with companies showing strong growth potential, backed by optimistic outlooks both from analysts and management.
- Find companies with promising cash flow potential yet trading below their fair value.
This article by Simply Wall St is general in nature. We provide commentary based on historical data and analyst forecasts only using an unbiased methodology and our articles are not intended to be financial advice. It does not constitute a recommendation to buy or sell any stock, and does not take account of your objectives, or your financial situation. We aim to bring you long-term focused analysis driven by fundamental data. Note that our analysis may not factor in the latest price-sensitive company announcements or qualitative material. Simply Wall St has no position in any stocks mentioned.
Have feedback on this article? Concerned about the content? Get in touch with us directly. Alternatively, email editorial-team@simplywallst.com