
- PRICING
- LIVE QUOTES
- LEARN
- HELP


EN
Top Asian Dividend Stocks To Consider In July 2026
As Asian markets navigate the complexities of fluctuating oil prices and geopolitical tensions, investors are increasingly turning their attention to dividend stocks as a potential source of stable income. In this environment, a good dividend stock is often characterized by a strong balance sheet and consistent payout history, offering reliability amidst broader market uncertainties.
Top 10 Dividend Stocks In Asia
| Name | Dividend Yield | Dividend Rating |
| SIGMAXYZ Holdings (TSE:6088) | 4.17% | ★★★★★★ |
| Sakai Moving ServiceLtd (TSE:9039) | 3.82% | ★★★★★★ |
| OUG Holdings (TSE:8041) | 3.86% | ★★★★★★ |
| NCD (TSE:4783) | 4.78% | ★★★★★★ |
| HUAYU Automotive Systems (SHSE:600741) | 6.03% | ★★★★★★ |
| Guangxi LiuYao Group (SHSE:603368) | 4.38% | ★★★★★★ |
| GakkyushaLtd (TSE:9769) | 4.57% | ★★★★★★ |
| Changjiang Publishing & MediaLtd (SHSE:600757) | 5.10% | ★★★★★★ |
| Business Brain Showa-Ota (TSE:9658) | 4.33% | ★★★★★★ |
| Binggrae (KOSE:A005180) | 4.90% | ★★★★★★ |
Click here to see the full list of 1044 stocks from our Top Asian Dividend Stocks screener.
Let's explore several standout options from the results in the screener.
Loncin Motor (SHSE:603766)
Simply Wall St Dividend Rating: ★★★★★☆
Overview: Loncin Motor Co., Ltd. is engaged in the manufacturing and sale of generating sets, agricultural machinery equipment, light-duty power units, and two-wheeled motorcycles both in Japan and internationally, with a market cap of CN¥29.80 billion.
Operations: Loncin Motor Co., Ltd.'s revenue comes from its production and sale of generating sets, agricultural machinery equipment, light-duty power units, and two-wheeled motorcycles.
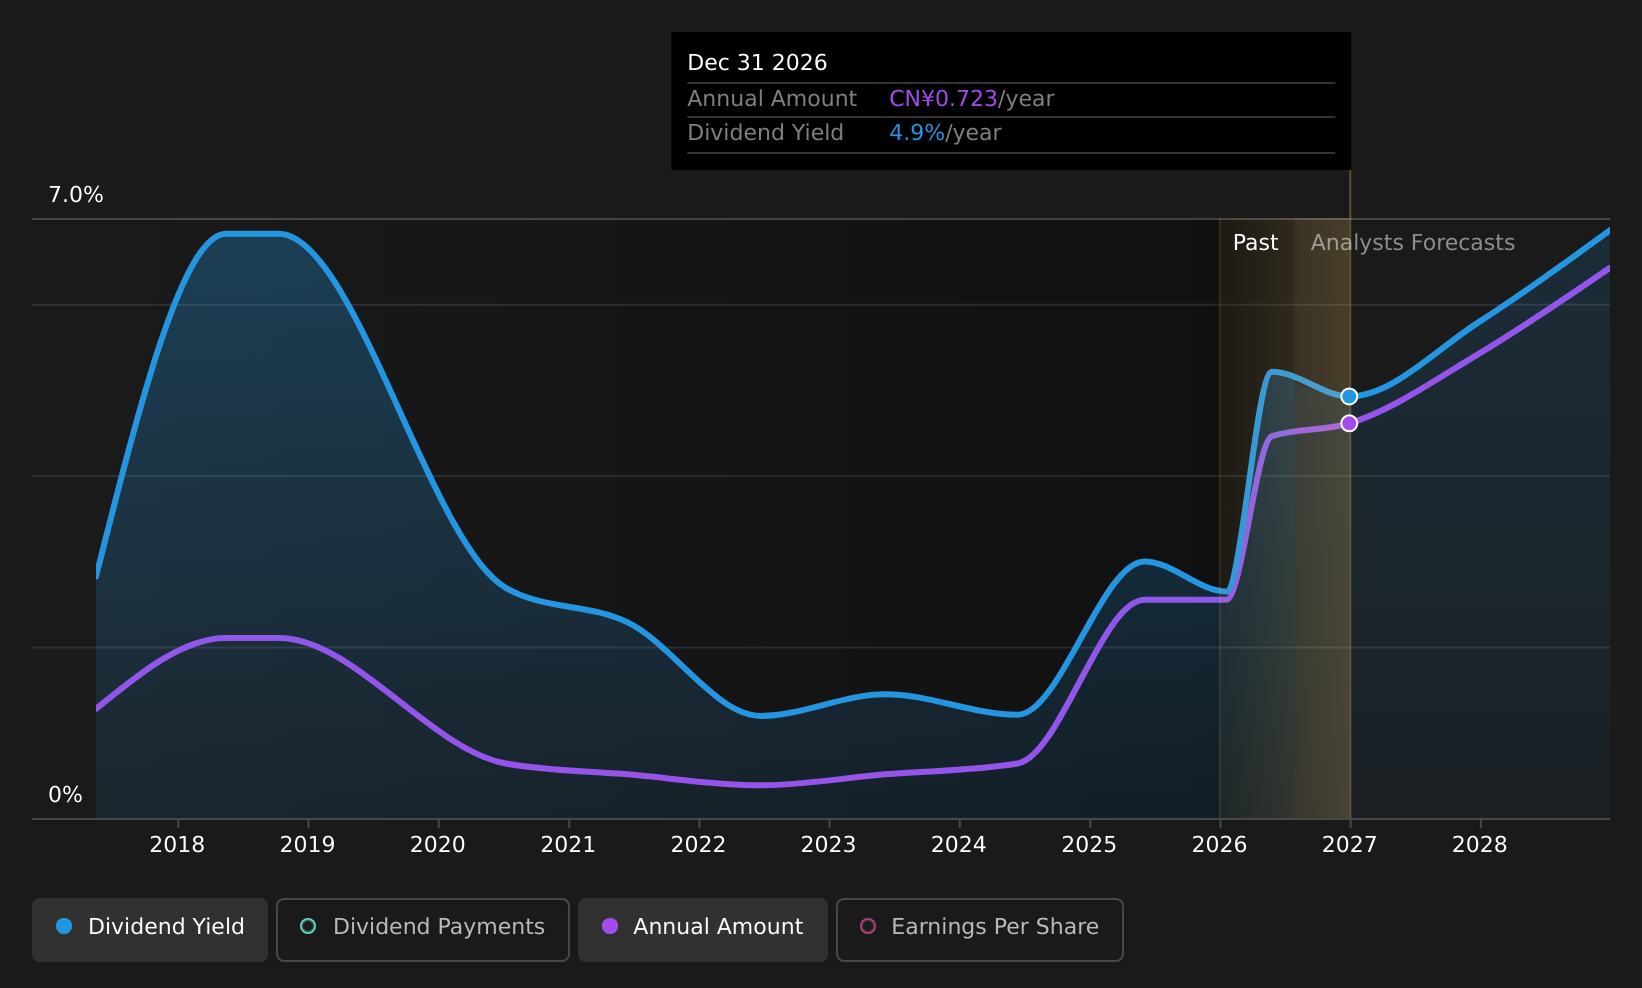
Dividend Yield: 4.8%
Loncin Motor's dividend payments are covered by both earnings and cash flows, with a payout ratio of 89.4% and a cash payout ratio of 69.5%. However, the dividends have been volatile over the past decade, experiencing significant drops at times. Despite this instability, dividends have increased over ten years. The stock trades at a discount to its estimated fair value and offers an attractive yield within China's top quartile of dividend payers.
- Click to explore a detailed breakdown of our findings in Loncin Motor's dividend report.
- Our valuation report here indicates Loncin Motor may be undervalued.
Zhejiang Xinao Textiles (SHSE:603889)
Simply Wall St Dividend Rating: ★★★★☆☆
Overview: Zhejiang Xinao Textiles Inc. is involved in the research, development, production, and sale of wool yarn and its intermediate products in China with a market capitalization of CN¥5.55 billion.
Operations: Zhejiang Xinao Textiles Inc. generates its revenue primarily through the production and sale of wool yarn and related intermediate products in China.
Dividend Yield: 4.6%
Zhejiang Xinao Textiles offers a dividend yield of 4.6%, placing it in the top 25% of dividend payers in China. Despite this attractive yield, the company's dividends have been volatile and not well covered by free cash flows, with a high cash payout ratio of 200.6%. While earnings growth is promising at 15.1% last year, dividends remain unreliable over the past decade. The stock trades below market average on a price-to-earnings basis at 11.1x.
- Get an in-depth perspective on Zhejiang Xinao Textiles' performance by reading our dividend report here.
- Our expertly prepared valuation report Zhejiang Xinao Textiles implies its share price may be lower than expected.

NSD (TSE:9759)
Simply Wall St Dividend Rating: ★★★★★☆
Overview: NSD Co., Ltd. offers a range of IT solutions in Japan and has a market cap of ¥222 billion.
Operations: NSD Co., Ltd.'s revenue segments include the Solution Business at ¥17.72 billion, System Development Business - Financial IT at ¥35.07 billion, System Development Business - Industrial IT at ¥28.29 billion, System Development Business - Social Infrastructure IT at ¥24.20 billion, and System Development Business - IT Infrastructure Construction at ¥13.30 billion.
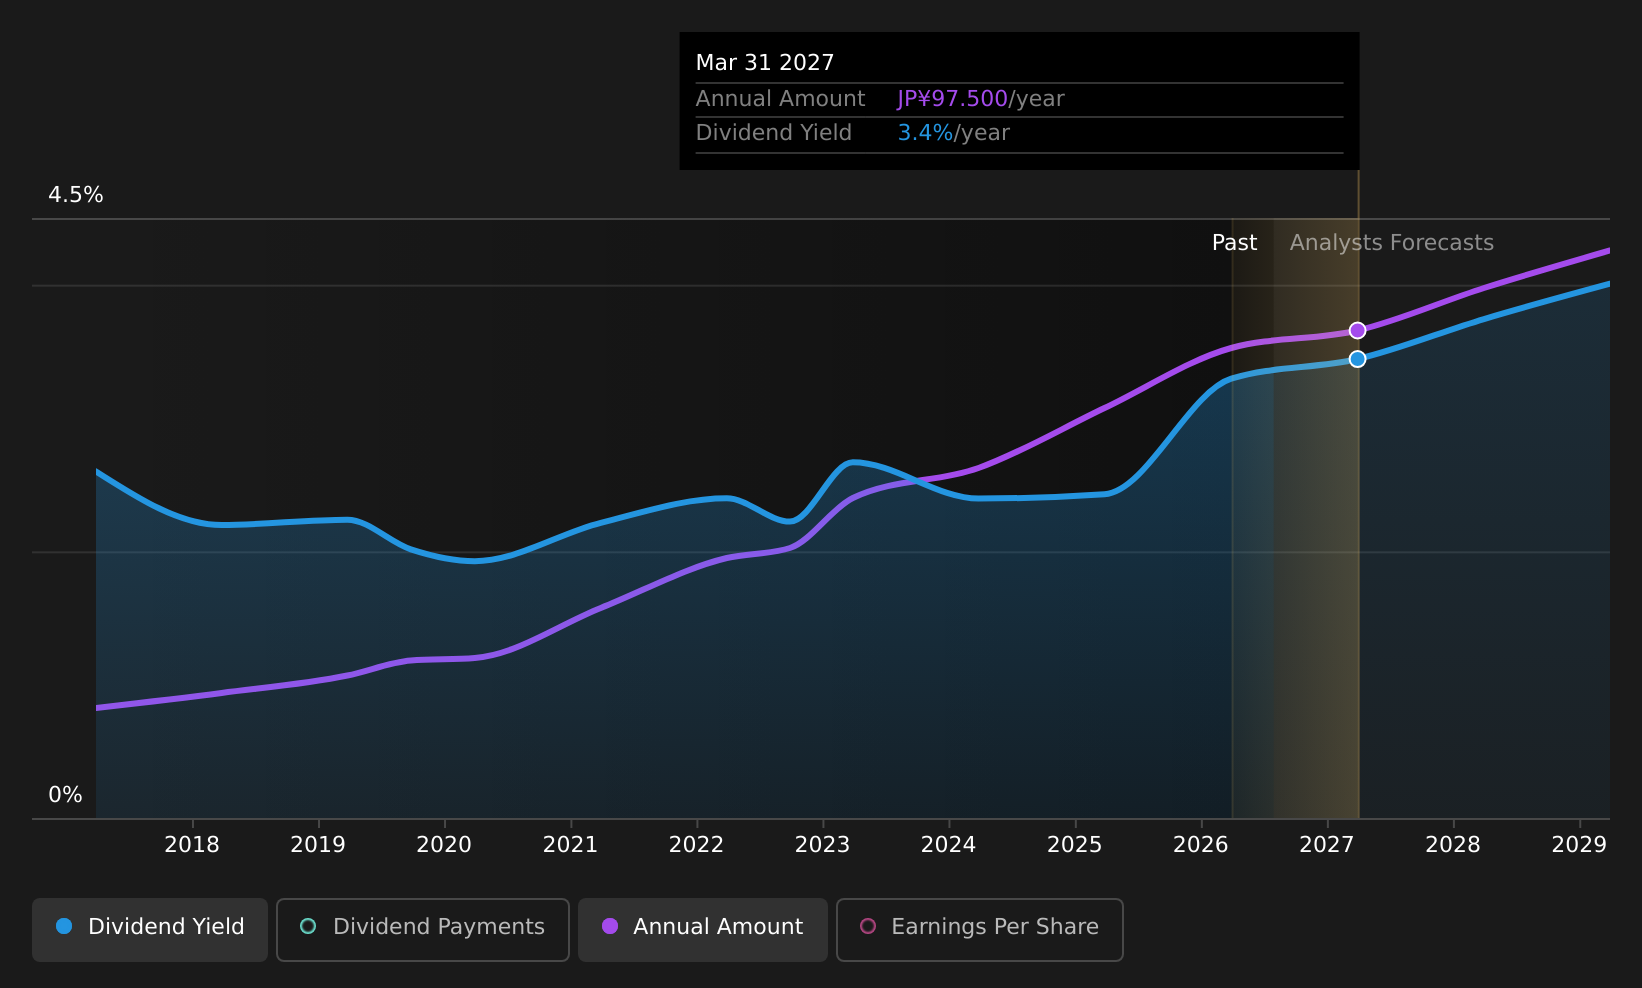
Dividend Yield: 3.3%
NSD Co., Ltd. has shown a stable and growing dividend over the past decade, with a current yield of 3.31%. While this yield is below the top quartile in Japan, dividends are well covered by earnings (payout ratio: 56.3%) and cash flows (cash payout ratio: 48.4%). Recent share buybacks, including ¥558.4 million spent on repurchasing shares, indicate a commitment to shareholder returns amidst solid earnings growth of 12.7% annually over five years.
- Dive into the specifics of NSD here with our thorough dividend report.
- In light of our recent valuation report, it seems possible that NSD is trading behind its estimated value.
Summing It All Up
- Dive into all 1044 of the Top Asian Dividend Stocks we have identified here.
- Invested in any of these stocks? Simplify your portfolio management with Simply Wall St and stay ahead with our alerts for any critical updates on your stocks.
- Simply Wall St is your key to unlocking global market trends, a free user-friendly app for forward-thinking investors.
Interested In Other Possibilities?
- Explore high-performing small cap companies that haven't yet garnered significant analyst attention.
- Fuel your portfolio with companies showing strong growth potential, backed by optimistic outlooks both from analysts and management.
- Find companies with promising cash flow potential yet trading below their fair value.
This article by Simply Wall St is general in nature. We provide commentary based on historical data and analyst forecasts only using an unbiased methodology and our articles are not intended to be financial advice. It does not constitute a recommendation to buy or sell any stock, and does not take account of your objectives, or your financial situation. We aim to bring you long-term focused analysis driven by fundamental data. Note that our analysis may not factor in the latest price-sensitive company announcements or qualitative material. Simply Wall St has no position in any stocks mentioned.
Have feedback on this article? Concerned about the content? Get in touch with us directly. Alternatively, email editorial-team@simplywallst.com