
- PRICING
- LIVE QUOTES
- LEARN
- HELP


EN
Passenger Transport Branch: National passenger car retail sales of 1.123 million vehicles fell 18% year on year from July 1 to 26
The Zhitong Finance App learned that on July 29, the China Passenger Transport Association published an article stating that on July 1-26, the national passenger car market retailed 1.123 million vehicles, down 18% from the same period last year, down 13% from the same period last month, and has sold 9.824 million units since this year, down 20% year on year; from July 1 to 26, passenger car manufacturers across the country wholesale sold 1,172 million vehicles, down 18% from the same period last year, down 33% from the same period last month. Since this year, 13.718 million vehicles have been sold, down 7% year on year.
In terms of new energy, from July 1 to 26, the national passenger car NEV market retailed 738,000 vehicles, down 2% from the same period last month, down 10% from the same period last month, with cumulative retail sales of 5.443 million units this year, down 13% year on year; from July 1 to 26, passenger car manufacturers across the country sold 820,000 new energy vehicles, up 6% from the same period last year, down 27% from the same period last month, and a total of 7.608 million vehicles have been sold since this year, up 5% year on year.
In terms of penetration rate, from July 1 to 26, the penetration rate of NEV retail sales in the national passenger car market was 65.7%; from July 1 to 26, the NEV wholesale penetration rate of passenger car manufacturers across the country was 70%.
In terms of production, the country produced 250,000 pure fuel light vehicles in the first to three weeks of July, down 56% from the same period last year, down 17% from the same period last month; overall hybrid and plug-in hybrid production in the first to three weeks of July was 219,000 units, down 16% from the same period last year and 1% from the same period last month.
Retail sales trend in the national passenger car market in July 2026
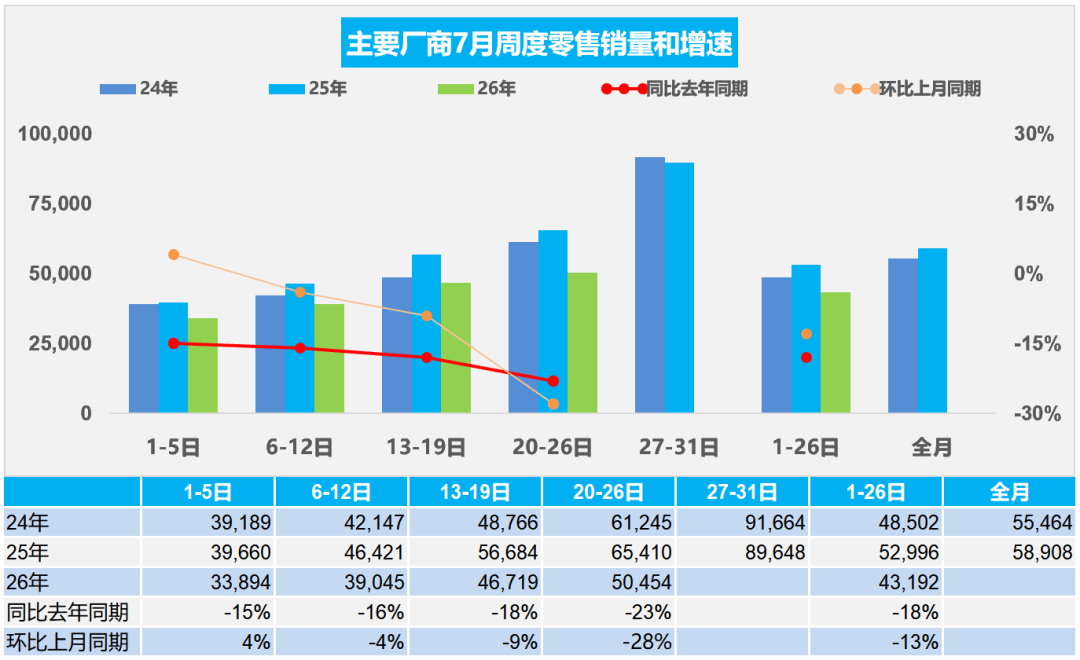
In the first week of July, the national passenger car market sold 34,000 vehicles per day, down 15% from the same period in July last year, and up 4% from the same period last month.
In the second week of July, the national passenger car market sold an average of 39,000 vehicles per day, down 16% from the same period last July and 4% from the same period last month.
In the third week of July, the national passenger car market sold 47,000 vehicles per day, down 18% from the same period in July last year and 9% from the same period last month.
The passenger car market sold an average of 50,000 units per day in the fourth week of July, down 23% from the same period in July last year and down 28% from the same period last month.
From July 1 to 26, the national passenger car market retailed 1.123 million vehicles, down 18% from the same period in July last year and 13% from the same period last month. Since this year, a total of 9.824 million vehicles have been sold, a year-on-year decrease of 20%.
In July, terminal retail was in the traditional low season, and overall consumer demand was weak, which became the core cause of weakening wholesale data. The World Cup, combined with the hot weather in midsummer, led to a sharp drop in offline customer traffic. Naturally, demand for car purchases was sluggish in the market. Consumer wait-and-see sentiment was strong, the household exchange cycle was lengthened, and the release of new cars was insufficient. At the same time, the terminal price war continued to overdraft the market in the first half of the year. Discounts from car companies and dealers were normalized, and the mentality of consumers holding coins to buy intensified, further suppressing the scale of terminal transactions. Affected by weak retail, dealers' inventory turnover efficiency decreased, and inventory pressure continued to accumulate, forcing the channel side to reduce receiving goods from manufacturers, forming a chain transmission effect of “weak retail - weak inventory replenishment - wholesale decline”.
There are highlights of partial structural recovery in the terminal market, which support the basic market market as a whole. Summer graduation car purchases and family self-driving trips drive family cars, SUVs, and new energy vehicles just need to be released slightly to stabilize basic retail sales. Furthermore, the national replacement subsidy policy continues to be implemented, effectively leveraging the replacement demand for old models and providing incremental support for mid-range model retail sales. With product iteration, policy dividends and cost performance advantages, the market resilience of new energy models is significantly superior to fuel vehicles, continuing to hedge against the sharp decline in fuel vehicle retail sales and ease the overall downward pressure on the terminal market.
The trend of wholesale sales of passenger car manufacturers nationwide in 2026
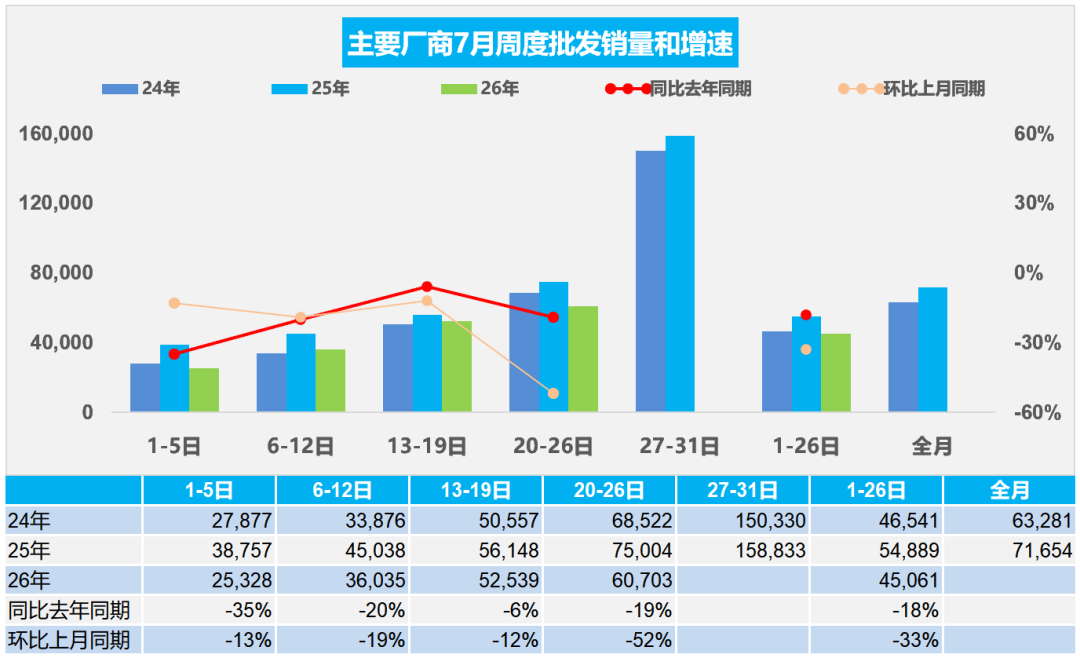
In the first week of 7, passenger car manufacturers across the country sold an average of 25,000 vehicles per day, down 35% from the same period last July and 13% from the same period last month.
In the second week of 7, passenger car manufacturers across the country sold 36,000 vehicles per day, down 20% from the same period in July last year, and down 19% from the same period last month.
In the third week of 7, passenger car manufacturers across the country sold an average of 53,000 vehicles per day, down 6% from the same period in July last year, and 12% from the same period last month.
In the fourth week of 7, passenger car manufacturers across the country sold an average of 61,000 vehicles per day, down 19% from the same period in July last year, and 52% lower than the same period last month.
From July 1 to 26, passenger car manufacturers across the country wholesale 1.172,000 vehicles, down 18% from the same period in July last year and 33% from the same period last month. Since this year, 13.718 million vehicles have been sold, a year-on-year decrease of 7%.
The core suppressing factors for manufacturers' sales in July were concentrated on the characteristics of the off-season market. In June, car companies' half-year impulse overdrafted market demand ahead of schedule, compounding the industry's high base for the same period last year, which greatly dragged down the current wholesale data. At the same time, oil prices have risen abnormally, terminal demand is weak, channel inventory is high, dealers' cash flow is under pressure, and their willingness to actively replenish stocks is sluggish. It is more difficult for car companies to store their warehouses. Most brands choose to control production and reduce volume, further dragging down batch shipments.
Currently, the wholesale side has structural support factors to hedge against some downward pressure. At the policy level, automobile trade-in and local car purchase subsidies continue to be implemented, combined with the implementation of the new national standard for new energy sources, and centralized distribution of compliant new models to provide structural increases for manufacturers to wholesale. At the production level, there are relatively sufficient working days in July. Some car companies rely on stable production capacity to guarantee the shipment of new products. At the same time, automobile exports continue to be booming, and overseas orders effectively divert surplus domestic production capacity, becoming an important supporting force for the wholesale side. Overall, the benefits are mainly structural hedging, and it is not possible to effectively reverse the overall decline in domestic wholesale volume for the time being.
Auto industry profit margin 3.8% from January to June 2026
From January to June 2026, in the face of multiple challenges such as the complex evolution of the international environment and domestic transformation pressure, the national economy started well, quality and efficiency improved, profits in the equipment manufacturing and high-tech manufacturing industries grew rapidly, and profits in the raw materials manufacturing industry grew by double digits, laying a solid foundation for the smooth operation of the economy throughout the year. Automobile production from January to June 2026 was 15.1 million units, a year-on-year decrease of 4%. From January to June 2026, the automobile industry's revenue was 5189.3 billion yuan, up 1.8% year on year; cost was 4610 billion yuan, up 2.8%; profit was 195.4 billion yuan, down 20% year on year; the profit margin of the automobile industry was 3.8%, compared with the average profit margin of 6.5% of downstream industrial enterprises, the automobile industry is still low.
The industry's sales margin of 3.8% from January to June 2026 and 5.2% in June was better than the monthly performance of 3.7% in March-April. Profit margins were generally high in June of previous years, and were at an abnormally high level in June of this year. Recently, with the increase in the production scale of the car market, PPI, profits in the upstream nonferrous and petroleum mining industries have skyrocketed. The price of lithium titanate is nearly 200,000 yuan, the unit price of lithium battery export tons fell 12% from January to June 2026 (down 26% in 2024 and 21% in 2025). Domestic battery prices are strong. Listed lithium battery companies have a payable period of 200 days and a payable period of 60 days. The problem of car companies' profits continue to decline.
In 2026, all regions will vigorously promote the implementation of the “two new” policies to gradually and effectively release the vitality of domestic demand. However, the improvement in efficiency in the automobile industry clearly lags behind other consumer goods. As the country's anti-domestic countervailing efforts continue to advance, the automobile industry is being severely squeezed upstream. The price problem is serious. Oil prices have skyrocketed, profits from non-ferrous metals and semiconductors have skyrocketed, end users have a serious wait-and-see mentality when buying cars, the operating pressure on car companies continues to increase, and high-quality development has been greatly impacted upstream.
In June 2026, the unit export price of lithium batteries was 105,000 yuan/ton
From January to June 2026, lithium battery exports reached US$48.7 billion, an increase of 43%. In June, lithium battery exports remained at US$8.7 billion, up 32% year on year. The export price of lithium-ion batteries fell from 273,000 US dollars/ton in 2023 and 201,000 US dollars/ton in 2024 to 151,000 US dollars/ton in 2026. The decline was only 8% in 2026, which is a significant improvement over the 26% drop in 2024 and 22% in 2025. However, the average export price of lithium batteries in June was 154,000 US dollars/ton, an increase of 1% over the previous year, and the unit price of exported tons is still at a historic low.
The main market for China's lithium battery exports is the European Union. In 2026, the EU's market demand will reach about 42%, an increase of 2 percentage points in 2026 compared to 2025. China's lithium battery exports to the US have shrunk sharply to 10%, down 6 percentage points in 2026 from 2025. The decline against the US continues to be huge.
Judging from the unit price of RMB caliber exports, the decline has been significant this year. The export price of lithium batteries has continued to drop in recent years. No matter how the price of lithium carbonate changes, the export price of lithium batteries continues to drop. The export price of lithium batteries fell 26% from 142,900 yuan in 2024 to 112,300 yuan in 2025, a drop of 21%. In 2026, 104,800 yuan decreased by 12%. Among them, the average price of batteries exported from China in June was 104,900 yuan, a year-on-year decrease of 4%. The price reduction after tax rebates were reduced in April-6 was a significant improvement over last year. The price of lithium batteries exported by China to the European Union fell rapidly, falling 25% from 153,400 yuan in 2024 to 125,500 yuan in 2025, falling 18%. In June 2026, the average price of batteries exported by China to the EU was 11.02 yuan/ton, a decrease of 18%.
Overall, in 2026, against the backdrop of a year-on-year decline in domestic NEV retail sales volume of nearly 20%, China's lithium batteries performed well in domestic price increases and foreign prices reduced, and export volumes increased in price declines. Relying on the expansion of emerging markets and deep cultivation in core markets, they effectively addressed the challenges brought about by changes in the internal environment.
In June, China exported 1.07 million vehicles, a year-on-year increase of 73%
From January to June 2026, China achieved exports of 5.31 million vehicles, a growth rate of 53% over the same period in 2025. In June, China achieved 1.07 million exports, an increase of 73% over the previous year and an increase of 8% over the previous year. The year-on-year trend was generally strong, and the month-on-month trend exceeded expectations. This year's main drivers are still high oil prices, increased competitiveness of Chinese products, and continued growth in the global southern markets.
The top 10 countries of China's total automobile exports in June 2026: Russia 84,451, Britain 62,487, Australia 60,510, Belgium 59,606, Philippines 46,243, Mexico 45,528, Algeria 33,358, Thailand 29,923, Malaysia 26,767, and Brazil 25,856. Among them, the top five were: Russia 58,053, Australia 41,065, Belgium 35,070, and the United Kingdom 33,913 and the Philippines 21,358. In the Russian market, Chinese car companies' awareness of risk prevention has increased, and exports to remove inventory in 2025 will be very strong. Exports to Russia recovered significantly from January to June 2026.
The top 10 countries with cumulative total vehicle exports from January to June 2026: Brazil 385,813, Russia 364,710, the United Kingdom 194,238, Australia 178,641, Mexico 164,955, Belgium 162,758, Italy 130,098, UAE 129,054, Algeria 109,575, and Thailand 106,217. Among them, the top five were: Brazil 244,737, Russia 210,285, and the United Kingdom 86,103, Algeria 82,086, and Italy 73,457.
In June 2026, China exported 463,000 new energy vehicles, up 59% year on year. The cumulative export performance of 2.42 million units from January to June was very good. The 70% increase was very good. In June, NEV exports showed strong month-on-month performance. In June 2026, pure electric vehicles accounted for 30% of China's automobile exports (0% YoY), hybrid accounts for 19% (YoY +8%), hybrids accounted for 7% (+1% YoY), and pure fuel vehicles accounted for 35% (YoY -8%).
China's top 10 NEV exports in June 2026: Belgium 57,217, UK 50,157, Australia 46,434, Philippines 43,466, Thailand 28,978, Germany 17,900, Spain 14,974, South Korea 13,764, Malaysia 12,399, and Brazil 11,089, with the top five incremental increases over the same period: Australia 34,736, Belgium 33,277, UK 31,305, and Philippines 24,927 Vehicles and Thailand's 20,980 vehicles.
The top 10 countries with total NEV exports from January to June 2026: Brazil 299,803, Belgium 209,217, UK 181,260, Australia 167,126, Thailand 126,646, Philippines 126,062, Germany 84,190, Italy 79,503, South Korea 75,430, and Spain 72,723. Among them, the top five were: Brazil 183,399, Australia 98,744, UK 89,216, Thailand 66,297 and Belgian 63,953.
China's NEV export performance from January to June 2026 was better than expected. Mainly, hybrid and hybrid vehicles replaced pure electric vehicles as a new growth point for export growth. In particular, the export performance of pure electric trucks was strong, which became the highlight of commercial vehicle NEV exports. The recovery in capacity contributed to a sharp increase in exports in June. China's NEV exports are mainly exported to Western Europe, Central and South America, and the Middle East market is blocked.