
- PRICING
- LIVE QUOTES
- LEARN
- HELP


EN
Manhattan Associates (MANH) Nears Earnings, Is The Stock Fully Valued?
Upcoming Earnings Put Manhattan Associates In Focus
Manhattan Associates (MANH) is back on investors’ radar as the supply chain software company heads into its earnings report this Tuesday after the bell, following a prior quarter that topped revenue expectations.
See our latest analysis for Manhattan Associates.
Manhattan Associates’ recent 10.03% 1 month share price return and 8.09% 3 month share price return contrast with a year to date share price decline of 9.33% and a 1 year total shareholder return decline of 31.52%. This suggests momentum has picked up in the short term as investors reassess growth prospects and risk around the upcoming earnings release.
If Manhattan Associates’ earnings story has you watching software and automation closely, it could be a moment to scan the broader robotics and automation space via the 34 robotics and automation stocks
After Manhattan Associates’ recent rebound, the stock still trades below both analyst targets and one estimate of intrinsic value, leaving a wide valuation gap. Is the current price a fair compromise, or is it a clear discount?
Most Popular Narrative: 4.6% Overvalued
The most followed narrative on Manhattan Associates pegs fair value at $145, slightly below the last close of $151.67, and frames the current earnings reset in terms of execution risk and valuation discipline.
The assumed bearish price target for Manhattan Associates is $145.0, which represents up to two standard deviations below the consensus price target of $184.0. This valuation is based on what can be assumed as the expectations of Manhattan Associates's future earnings growth, profit margins and other risk factors from analysts on the more bearish end of the spectrum.
Want to see what is built into that $145 fair value for Manhattan Associates? The narrative leans on steady revenue expansion, firmer margins, and a premium earnings multiple that still sits above a broad software benchmark. The tension is how much growth and profitability the model assumes before that multiple relaxes.
Result: Fair Value of $145 (OVERVALUED)
Have a read of the narrative in full and understand what's behind the forecasts.
However, Manhattan Associates could surprise this cautious narrative if cloud and services demand stays firm and recent AI and ActivePlatform launches support steadier revenue visibility.
Find out about the key risks to this Manhattan Associates narrative.
Another Take On Manhattan Associates’ Valuation
While the bearish narrative argues Manhattan Associates is 4.6% overvalued at $151.67 versus a $145 fair value, the SWS DCF model points in the opposite direction. On that view, the stock is trading at $151.67 compared with an estimated future cash flow value of $252.63, which screens as undervalued. Which story do you find more convincing?
Before leaning toward either signal, it is worth understanding how the cash flow assumptions, discount rate and terminal expectations differ between the analyst narrative and the SWS DCF model, since small changes in those inputs can swing the result from caution to optimism. Look into how the SWS DCF model arrives at its fair value.
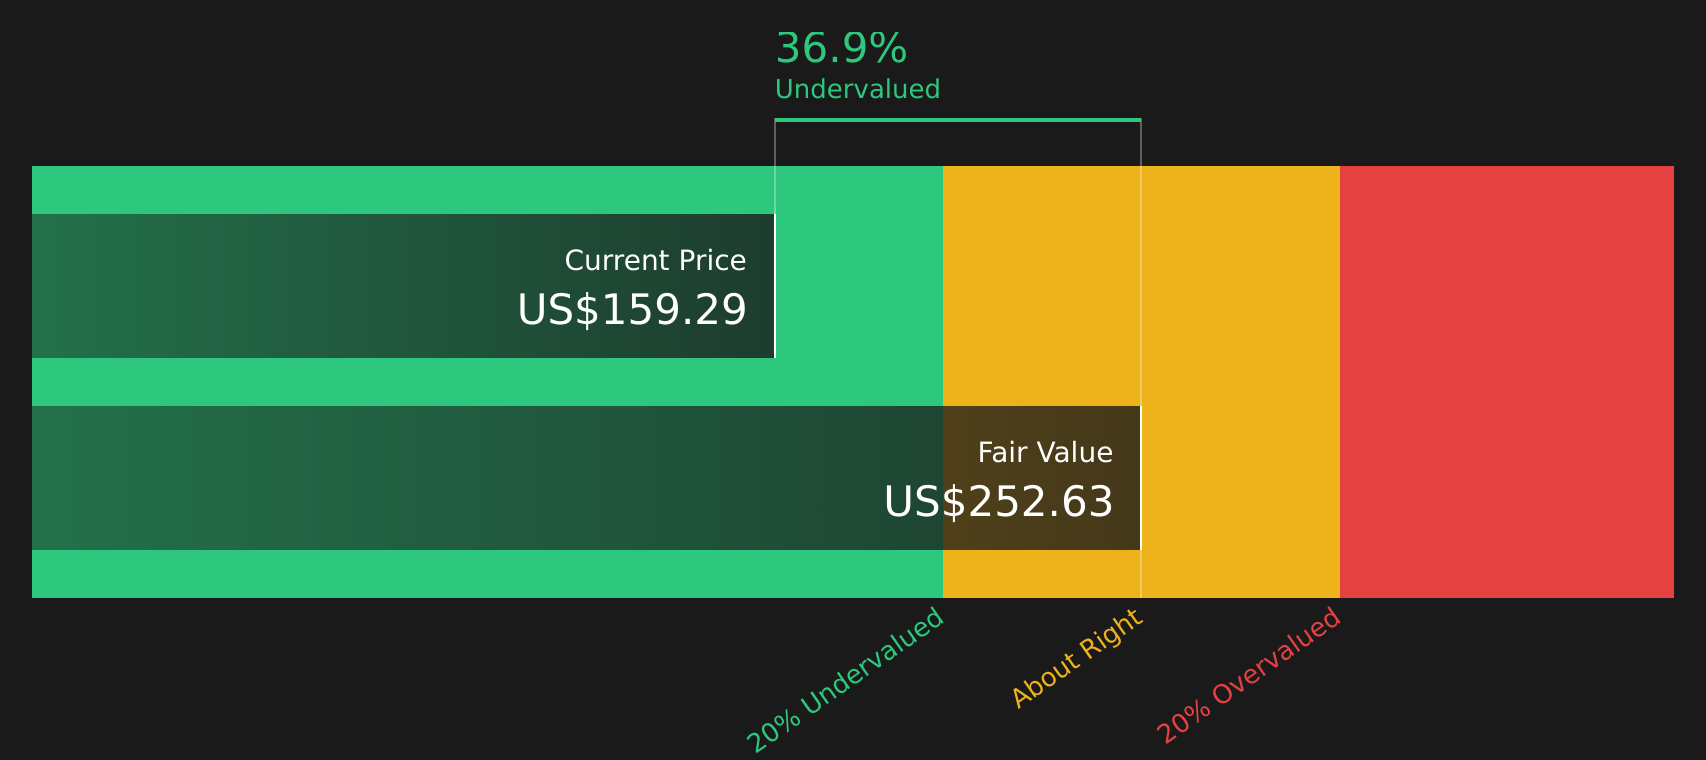
Simply Wall St performs a discounted cash flow (DCF) on every stock in the world every day (check out Manhattan Associates for example). We show the entire calculation in full. You can track the result in your watchlist or portfolio and be alerted when this changes, or use our stock screener to discover 50 high quality undervalued stocks. If you save a screener we even alert you when new companies match - so you never miss a potential opportunity.
Next Steps
With sentiment on Manhattan Associates clearly mixed, it makes sense to look at the full set of data yourself and move quickly to shape your view while investors are focused on the upcoming report. Then weigh those signals against the 3 key rewards
Looking For More Investment Ideas Beyond Manhattan Associates?
If Manhattan Associates has sharpened your focus on quality, do not stop here. Use the Simply Wall St screener to quickly surface other clear, data driven ideas.
- Target dependable cash generators by reviewing companies screened as solid balance sheet and fundamentals stocks screener (49 results) to see which businesses pair prudent finances with support from underlying fundamentals.
- Hunt for potential mispricings by checking the screener containing 20 high quality undiscovered gems that the market may not be paying full attention to yet.
- Prioritise stability and capital preservation by scanning 84 resilient stocks with low risk scores so you can focus on stocks with lower risk scores already assessed for you.
This article by Simply Wall St is general in nature. We provide commentary based on historical data and analyst forecasts only using an unbiased methodology and our articles are not intended to be financial advice. It does not constitute a recommendation to buy or sell any stock, and does not take account of your objectives, or your financial situation. We aim to bring you long-term focused analysis driven by fundamental data. Note that our analysis may not factor in the latest price-sensitive company announcements or qualitative material. Simply Wall St has no position in any stocks mentioned.
Have feedback on this article? Concerned about the content? Get in touch with us directly. Alternatively, email editorial-team@simplywallst.com