
- PRICING
- LIVE QUOTES
- LEARN
- HELP


EN
Is Griffon (GFF) Undervalued Following Its Recent Pullback?
Griffon (GFF) is in focus after recent trading left the stock around $90.62, with returns mixed across different periods, including a gain over the past year but a decline in the past month.
See our latest analysis for Griffon.
Griffon’s recent share price return has cooled, with the stock down 6.02% over the past month after a stronger 20.76% year to date share price return and a 3 year total shareholder return above 100%. This suggests momentum has eased, but longer term holders have still seen substantial gains.
If Griffon’s move has you thinking about what else might be setting up for the next leg, this could be a good time to scan 18 top founder-led companies
For Griffon, a softer share price over the past month alongside strong multi year returns and higher net income raises a simple tension: are investors reassessing the business itself, or just cooling on the story for now as valuation comes into focus?
Most Popular Narrative: 23.5% Undervalued
Griffon is trading at $90.62 against a widely followed narrative fair value of $118.43, putting the focus squarely on what justifies that gap.
The asset-light, flexible global sourcing model and cost optimization initiatives in Consumer and Professional Products (CPP) are expected to drive long-term margin expansion once consumer demand rebounds, enabling eventual recovery in segment EBITDA and overall earnings power.
Read the complete narrative. Read the complete narrative.
Want to see what sits behind that fair value for Griffon? Earnings are modeled to grow much faster than revenue, with margins and future multiples doing most of the heavy lifting.
Result: Fair Value of $118.43 (UNDERVALUED)
Have a read of the narrative in full and understand what's behind the forecasts.
However, Griffon’s story could change quickly if weak consumer demand in Consumer and Professional Products persists, or if higher tariffs and input costs further pressure margins and cash flow.
Find out about the key risks to this Griffon narrative.
Another View on Griffon’s Valuation
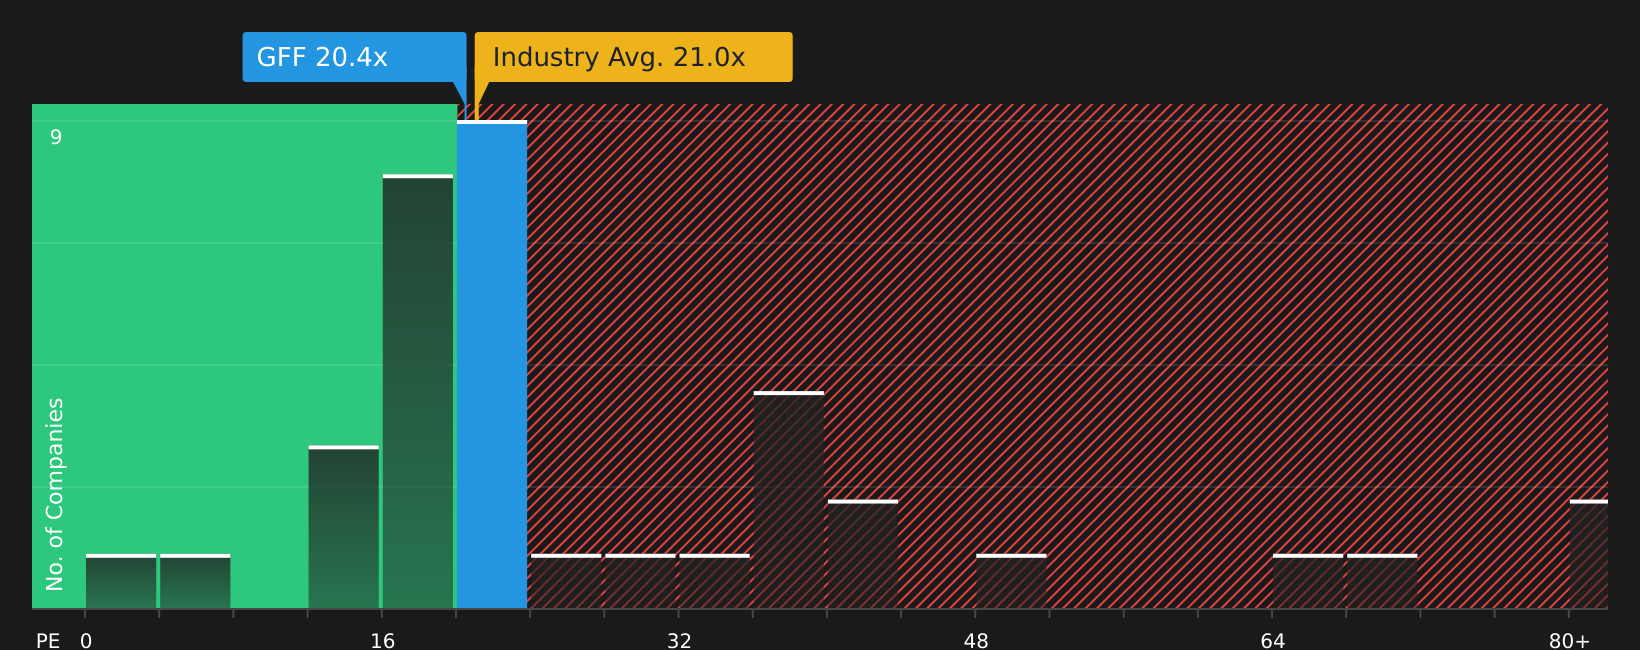
While Griffon screens as about 10.9% below the internal fair value estimate of $101.70 on our DCF model, the market is currently paying a P/E of 93x, versus an industry average of 22.5x and a fair ratio of 38.5x. This points to meaningful valuation risk if sentiment shifts.
For a closer look at how earnings assumptions translate into today’s price tag, including where the fair ratio could move over time, see what the numbers say in our valuation breakdown: See what the numbers say about this price — find out in our valuation breakdown.
Next Steps
If this mix of optimism and concern around Griffon feels familiar, treat it as your cue to review the data yourself and weigh up the 3 key rewards and 4 important warning signs.
Looking for more ideas beyond Griffon?
If Griffon has your attention, do not stop there. Use the screener to uncover other stocks that fit your style before the next wave of opportunities moves on.
- Target value by focusing on companies that combine quality fundamentals with attractive pricing using the 50 high quality undervalued stocks.
- Prioritize resilience by zeroing in on businesses that carry stronger financial foundations through the solid balance sheet and fundamentals stocks screener (49 results).
- Hunt for potential standouts early by running the screener containing 20 high quality undiscovered gems before they are widely followed.
This article by Simply Wall St is general in nature. We provide commentary based on historical data and analyst forecasts only using an unbiased methodology and our articles are not intended to be financial advice. It does not constitute a recommendation to buy or sell any stock, and does not take account of your objectives, or your financial situation. We aim to bring you long-term focused analysis driven by fundamental data. Note that our analysis may not factor in the latest price-sensitive company announcements or qualitative material. Simply Wall St has no position in any stocks mentioned.
Have feedback on this article? Concerned about the content? Get in touch with us directly. Alternatively, email editorial-team@simplywallst.com