
- PRICING
- LIVE QUOTES
- LEARN
- HELP


EN
3 European Dividend Stocks To Consider With Up To 9.3% Yield
The European market has recently shown resilience, with the pan-European STOXX Europe 600 Index ending the week up 0.46% amid robust corporate earnings and geopolitical tensions affecting energy prices. As investors navigate these dynamic conditions, dividend stocks can offer a steady income stream, making them an attractive option for those seeking stability in their portfolios during uncertain times.
Top 10 Dividend Stocks In Europe
| Name | Dividend Yield | Dividend Rating |
| Zurich Insurance Group (SWX:ZURN) | 4.07% | ★★★★★★ |
| Teleperformance (ENXTPA:TEP) | 7.99% | ★★★★★★ |
| Telekom Austria (WBAG:TKA) | 4.30% | ★★★★★★ |
| Swiss Re (SWX:SREN) | 4.87% | ★★★★★★ |
| Rubis (ENXTPA:RUI) | 6.33% | ★★★★★★ |
| Hannover Rück (XTRA:HNR1) | 4.94% | ★★★★★★ |
| Edel SE KGaA (XTRA:EDL) | 6.12% | ★★★★★★ |
| Cembra Money Bank (SWX:CMBN) | 5.20% | ★★★★★★ |
| Bouygues (ENXTPA:EN) | 4.42% | ★★★★★☆ |
| Banque Cantonale Vaudoise (SWX:BCVN) | 3.46% | ★★★★★☆ |
Click here to see the full list of 202 stocks from our Top European Dividend Stocks screener.
Below we spotlight a couple of our favorites from our exclusive screener.
Fleury Michon (ENXTPA:ALFLE)
Simply Wall St Dividend Rating: ★★★★☆☆
Overview: Fleury Michon SA manufactures and sells food products both in France and internationally, with a market cap of €90.68 million.
Operations: Fleury Michon SA generates revenue through its Division GMS France (€694.78 million), Other Sectors France (€79.54 million), and International Division (€110.94 million).
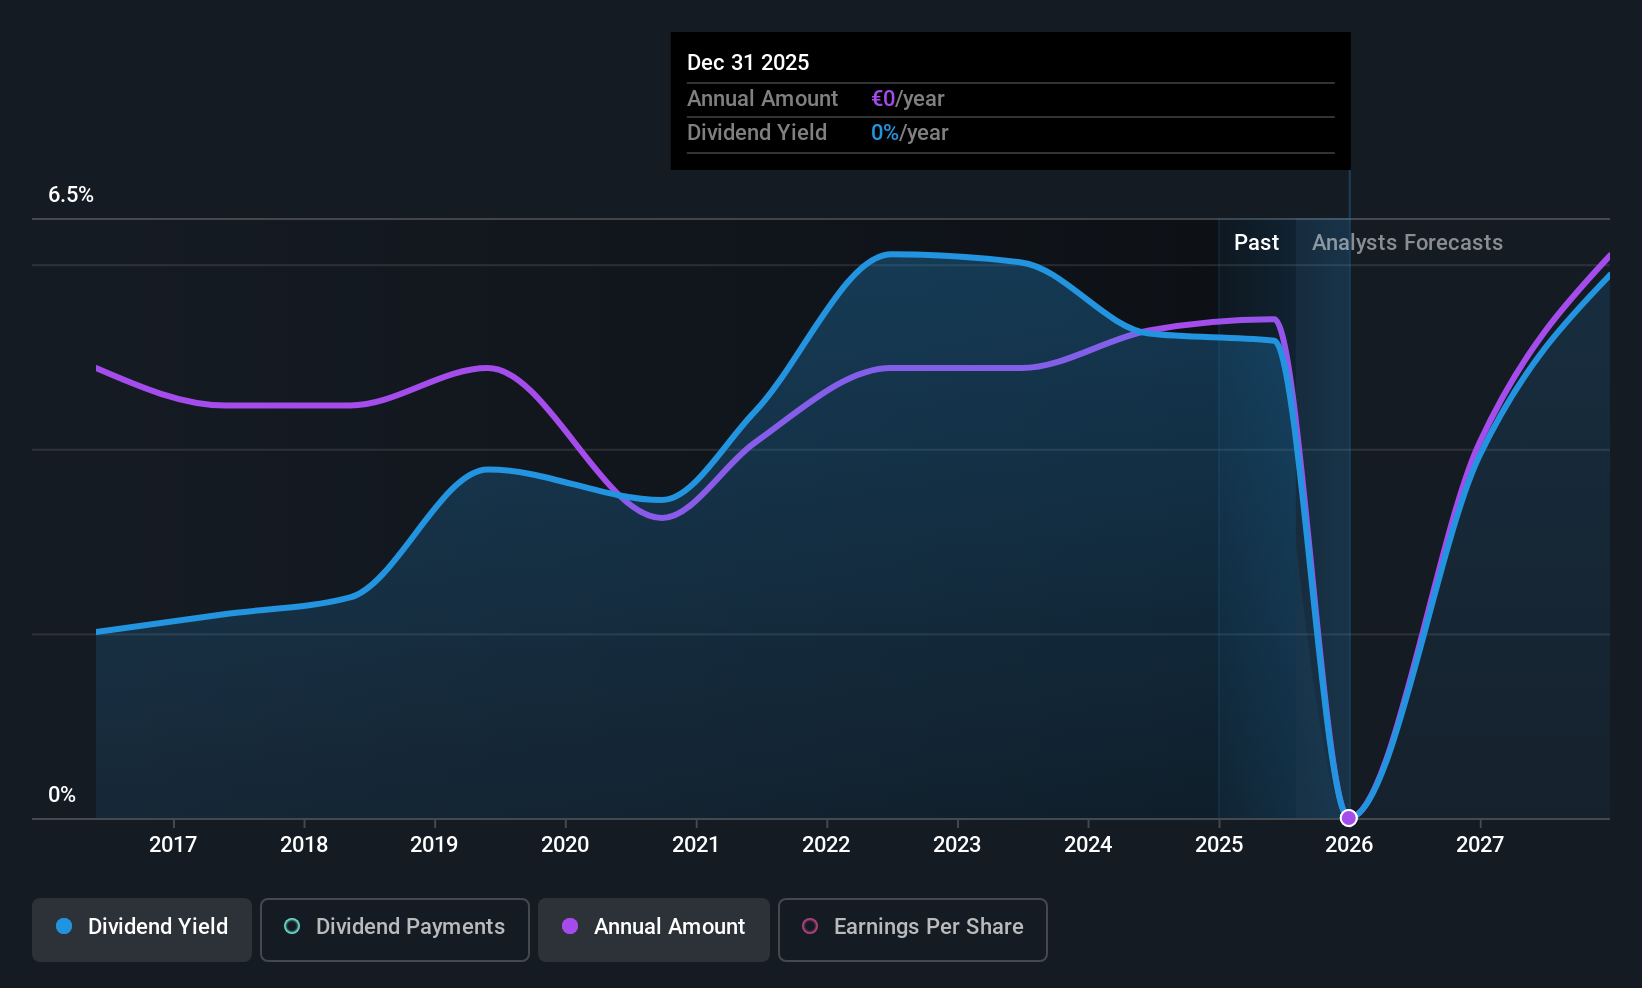
Dividend Yield: 6.2%
Fleury Michon offers a dividend yield of 6.16%, placing it in the top 25% of French dividend payers, yet its dividends have been volatile over the past decade. Despite being covered by earnings with a payout ratio of 66.8%, dividends are not supported by free cash flows, raising sustainability concerns. The company trades at a good value compared to peers and industry, but recent profit margins have declined from last year’s figures.
- Click here and access our complete dividend analysis report to understand the dynamics of Fleury Michon.
- Our comprehensive valuation report raises the possibility that Fleury Michon is priced lower than what may be justified by its financials.
Komercní banka (SEP:KOMB)
Simply Wall St Dividend Rating: ★★★★☆☆
Overview: Komercní banka, a.s. operates as a provider of retail, corporate, and investment banking services mainly in the Czech Republic and Central and Eastern Europe, with a market capitalization of CZK193.01 billion.
Operations: Komercní banka, a.s., along with its subsidiaries, generates revenue through its diverse range of retail, corporate, and investment banking services across the Czech Republic and Central and Eastern Europe.
Dividend Yield: 9.4%
Komercní banka's dividend yield of 9.35% ranks it among the top 25% in the Czech market, but its dividends have been volatile and unreliable over the past decade. The bank's recent fixed-income offerings, totaling nearly €1.5 billion, may impact future cash flows. While trading below estimated fair value and at a good relative value compared to peers, its high payout ratio of 100% raises concerns about dividend sustainability despite forecasts for improved coverage in three years.
- Get an in-depth perspective on Komercní banka's performance by reading our dividend report here.
- Our expertly prepared valuation report Komercní banka implies its share price may be lower than expected.

UNIQA Insurance Group (WBAG:UQA)
Simply Wall St Dividend Rating: ★★★★★☆
Overview: UNIQA Insurance Group AG is an insurance company that provides services in Austria and Central and Eastern Europe, with a market cap of €5.37 billion.
Operations: UNIQA Insurance Group AG's revenue is primarily derived from its UNIQA Austria segments, with €2.54 billion from Property and Casualty Insurance, €1.37 billion from Health, and €298.03 million from Life; alongside its UNIQA International segments contributing €2.43 billion in Property and Casualty Insurance, €773.52 million in Life, and €140.76 million in Health insurance services.
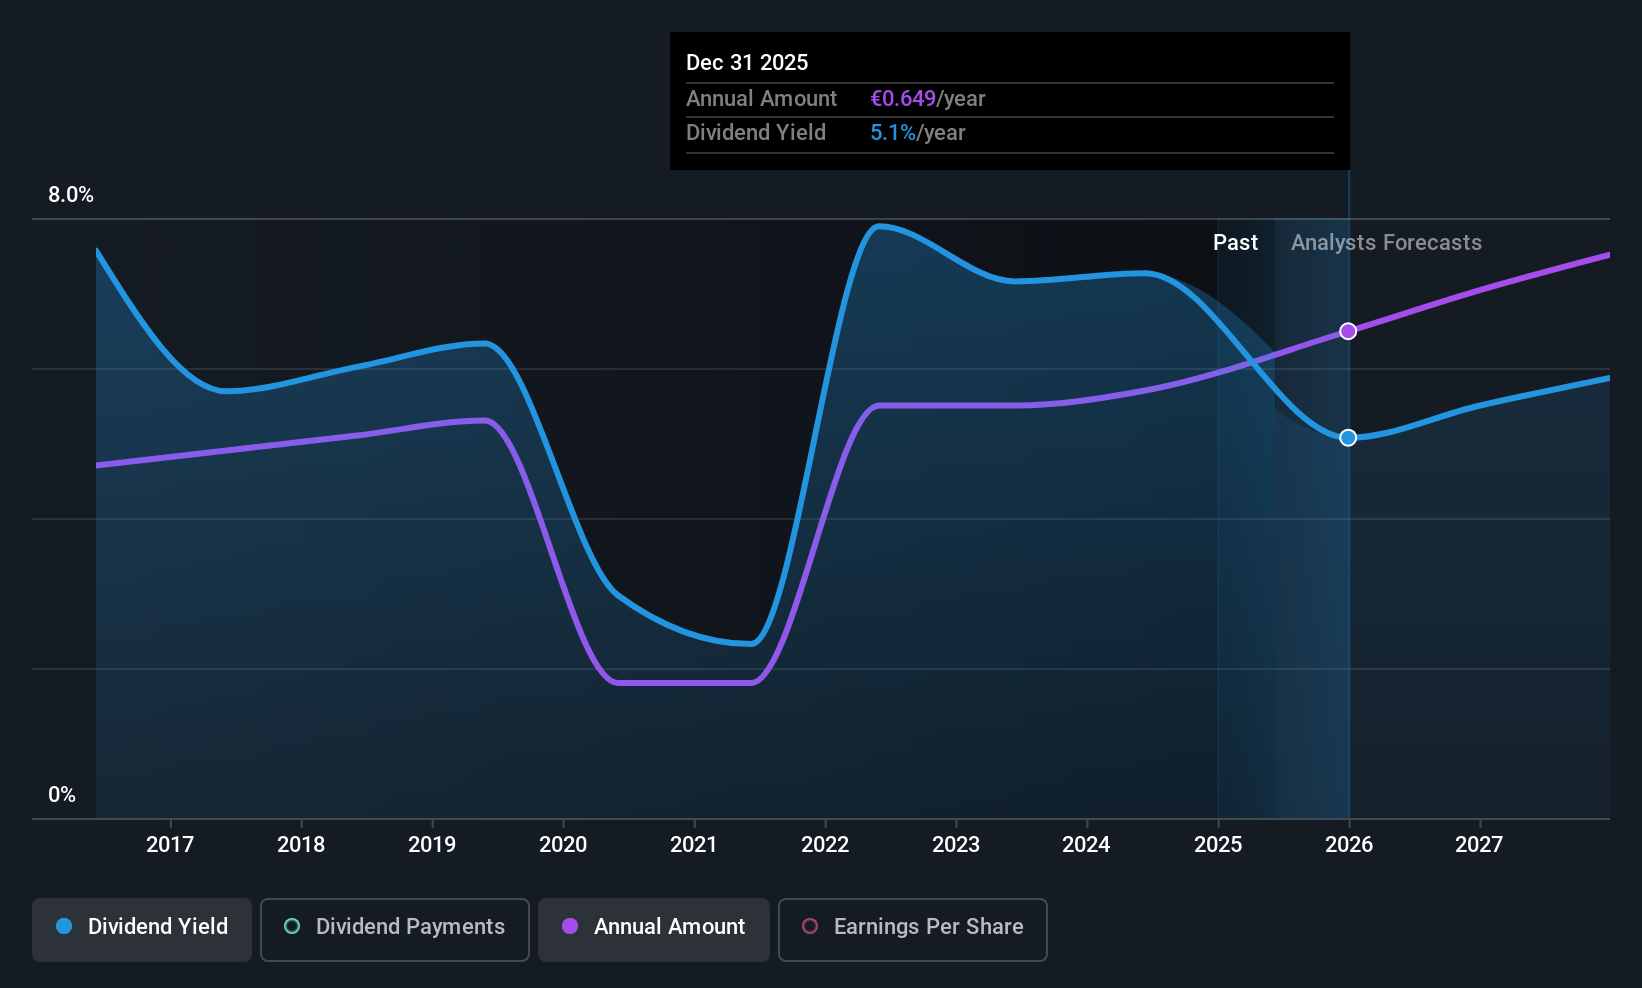
Dividend Yield: 4.1%
UNIQA Insurance Group's dividend yield of 4.11% places it in the top 25% of Austrian dividend payers, yet its dividends have been volatile over the past decade. Recent approval for a €0.72 per share dividend highlights ongoing payouts, supported by a reasonable payout ratio of 52% and low cash payout ratio of 26.3%. Despite trading at a significant discount to fair value, its unstable dividend history warrants cautious consideration for income-focused investors.
- Unlock comprehensive insights into our analysis of UNIQA Insurance Group stock in this dividend report.
- In light of our recent valuation report, it seems possible that UNIQA Insurance Group is trading behind its estimated value.
Summing It All Up
- Gain an insight into the universe of 202 Top European Dividend Stocks by clicking here.
- Are these companies part of your investment strategy? Use Simply Wall St to consolidate your holdings into a portfolio and gain insights with our comprehensive analysis tools.
- Enhance your investing ability with the Simply Wall St app and enjoy free access to essential market intelligence spanning every continent.
Contemplating Other Strategies?
- Explore high-performing small cap companies that haven't yet garnered significant analyst attention.
- Fuel your portfolio with companies showing strong growth potential, backed by optimistic outlooks both from analysts and management.
- Find companies with promising cash flow potential yet trading below their fair value.
This article by Simply Wall St is general in nature. We provide commentary based on historical data and analyst forecasts only using an unbiased methodology and our articles are not intended to be financial advice. It does not constitute a recommendation to buy or sell any stock, and does not take account of your objectives, or your financial situation. We aim to bring you long-term focused analysis driven by fundamental data. Note that our analysis may not factor in the latest price-sensitive company announcements or qualitative material. Simply Wall St has no position in any stocks mentioned.
Have feedback on this article? Concerned about the content? Get in touch with us directly. Alternatively, email editorial-team@simplywallst.com