
- PRICING
- LIVE QUOTES
- LEARN
- HELP


EN
AMETEK (AME) Stock Could Be 39% Pricey On Cash Flow And Earnings
AMETEK stock has delivered a strong 79.8% return over the past five years, yet current valuation checks, including an intrinsic value estimate based on a Discounted Cash Flow (DCF) model and market multiples, both point to the shares trading at a premium rather than offering clear value.
- The 79.8% five year return highlights that long term holders have already captured a substantial gain. This can reduce the margin of safety for new investors if fundamentals do not keep pace.
- Expectations for continued cash flow generation can support the current share price, but any pressure on margins or delays in converting earnings into cash may weigh on what investors are willing to pay.
- With AMETEK only ticking 2 of 6 valuation checks, the broader picture leans expensive rather than pointing to an obvious bargain.
The issue now is whether AMETEK's current price already reflects most of its strengths, or if there is still a reasonable case that the stock offers value at these levels.
Find out why AMETEK's 35.2% return over the last year is lagging behind its peers.
Does AMETEK Look Pricey on Cash Flow?
The Discounted Cash Flow (DCF) approach looks at the cash AMETEK can generate for shareholders over time and discounts it back to today. For AMETEK, the latest twelve month free cash flow sits at about $1.7b, and the model assumes that cash flows continue growing from this level rather than shrinking.
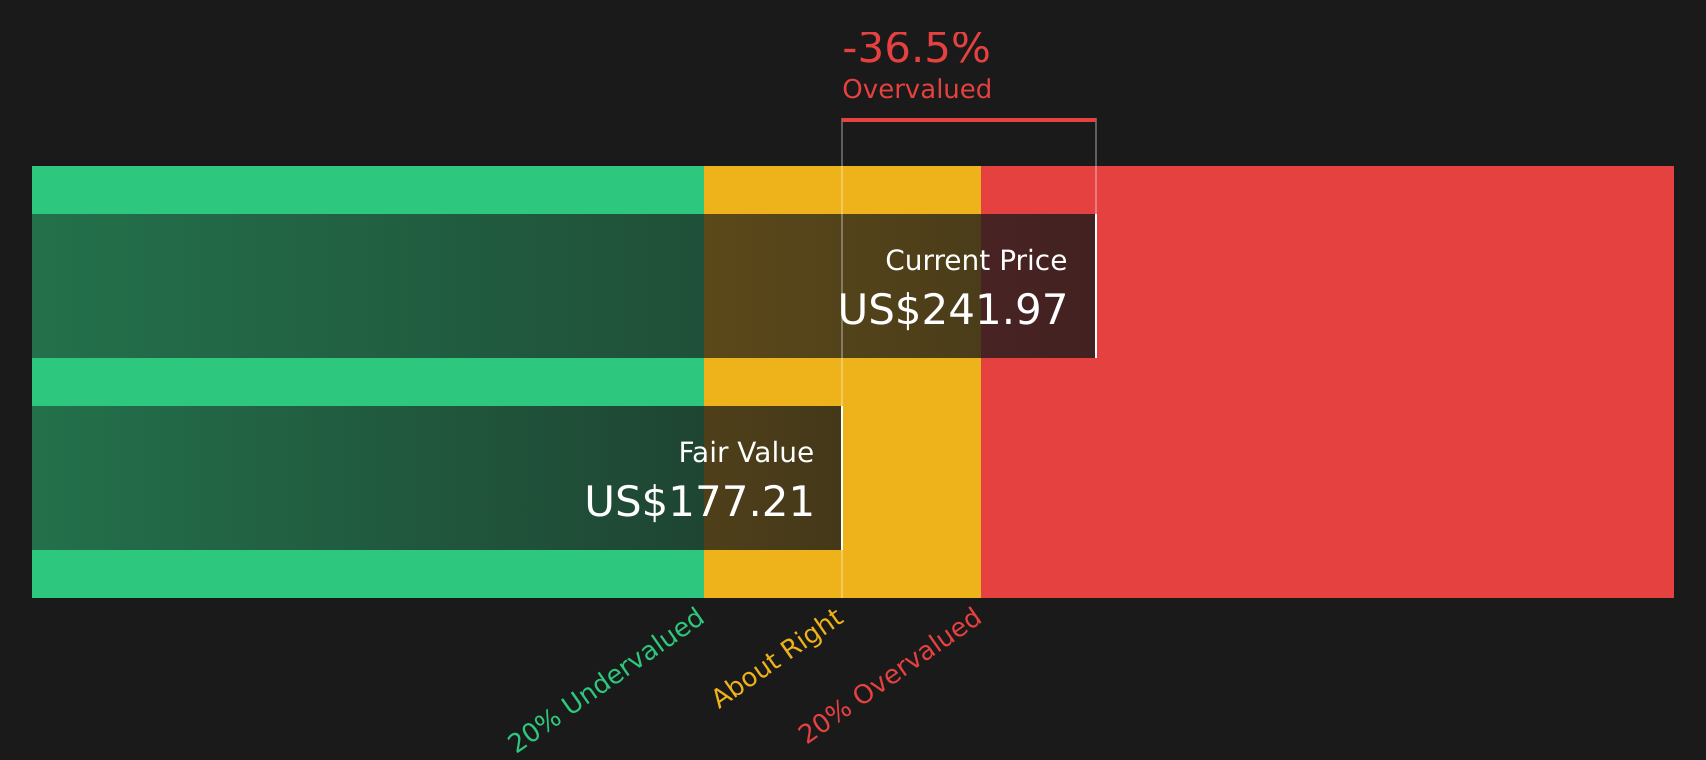
Based on those cash flow projections, the 2 Stage Free Cash Flow to Equity model points to an estimated intrinsic value of about $175 per share. With the current share price implying roughly a 38.6% premium to that estimate, the DCF outcome suggests AMETEK stock is pricing in a lot of strength already rather than leaving a clear valuation cushion.
On the DCF numbers alone, AMETEK appears overvalued relative to its projected cash flows.
Our Discounted Cash Flow (DCF) analysis suggests AMETEK may be overvalued by 38.6%. Discover 49 high quality undervalued stocks or create your own screener to find better value opportunities.
Is AMETEK Getting Expensive on Earnings?
The P/E ratio fits AMETEK well because earnings are a key focus for how this stock is valued. AMETEK currently trades at about 36.3x earnings, which is slightly below the Electrical industry average of roughly 37.2x and also under the peer group average of about 40.2x. On simple comparisons, that puts the stock around the middle of the pack rather than screening as obviously cheap.
A more tailored yardstick is the fair P/E ratio, which is estimated at about 28.1x based on AMETEK's profile and risk factors. Set against the current 36.3x multiple, the market is paying a clear premium relative to that fair level. This suggests investors are already pricing in a lot of the quality and earnings power reflected in recent numbers.
On the P/E multiple, AMETEK stock currently screens as overvalued compared with what the fair ratio model suggests investors might typically pay.

See what the numbers say about this price — find out in our valuation breakdown.
The AMETEK Narrative: What Would Justify Today's Price?
Simply Wall St Narratives for AMETEK pick up where the valuation checks leave off by spelling out which paths for AMETEK's growth, margins and earnings would need to play out for the stock to be worth materially more or less than it is today on the market. Instead of giving a single output from a ratio or model, these narratives describe the future that figure relies on, so you can watch how AMETEK's reality lines up over time on the Community page.
Share a narrative on AMETEK to present your own number-driven view on the potential direction of its growth, margins, and execution, and compare how your thesis holds up as new results are reported.
Do you think there's more to the story for AMETEK? Head over to our Community to see what others are saying!
The Bottom Line
For AMETEK, both the Discounted Cash Flow (DCF) intrinsic value estimate and the P/E based checks point to an overvalued stock rather than a clear opportunity. The broader valuation framework, which only flags a limited number of positives, reinforces that the current price already reflects a great deal of quality and execution. From here, the key question is whether AMETEK can continue delivering the cash flows and earnings that investors appear to be paying for, or whether sentiment cools if margins or growth fall short of what the current multiples imply.
This article by Simply Wall St is general in nature. We provide commentary based on historical data and analyst forecasts only using an unbiased methodology and our articles are not intended to be financial advice. It does not constitute a recommendation to buy or sell any stock, and does not take account of your objectives, or your financial situation. We aim to bring you long-term focused analysis driven by fundamental data. Note that our analysis may not factor in the latest price-sensitive company announcements or qualitative material. Simply Wall St has no position in any stocks mentioned.
Have feedback on this article? Concerned about the content? Get in touch with us directly. Alternatively, email editorial-team@simplywallst.com