
- PRICING
- LIVE QUOTES
- LEARN
- HELP


EN
American Airlines Group (AAL) Could Be 31% Below Fair Value After Record Revenue
American Airlines Group (AAL) stock was in focus after the company reported record second quarter revenue and issued new third quarter guidance, highlighting strong sales expectations alongside pressure from higher fuel costs.
See our latest analysis for American Airlines Group.
Despite record revenue, American Airlines Group’s latest weak profit guidance and concern around fuel expenses coincide with a sharp pullback, with the stock’s 30 day share price return down 16.02% but its 1 year total shareholder return still up 18.28%. This suggests that recent momentum has cooled after a stronger stretch.
If earnings volatility in airlines has you looking wider, this could be a useful moment to scan other transportation linked and infrastructure themes using our screener for 35 power grid technology and infrastructure stocks
American Airlines Group now sits at the crossroads of a strong revenue story and a weaker profit outlook, especially after the recent share price pullback. So how is the stock actually priced today on the fundamentals?
Most Popular Narrative: 30.8% Undervalued
With American Airlines Group last closing at $13.56 against a narrative fair value of $19.60, the current setup hinges on how future earnings and margins evolve from today’s thin profitability.
The analysts have a consensus price target of $19.6 for American Airlines Group based on their expectations of its future earnings growth, profit margins and other risk factors.
However, there is a degree of disagreement amongst analysts, with the most bullish reporting a price target of $25.0, and the most bearish reporting a price target of just $10.0.
Want to understand why the most followed narrative sees room above today’s price? It rests on anticipated earnings growth, firmer margins, and a future earnings multiple that assumes the current profit picture looks very different a few years from now.
Result: Fair Value of $19.60 (UNDERVALUED)
Have a read of the narrative in full and understand what's behind the forecasts.
However, for American Airlines Group, high labor costs and a sizeable debt load could quickly pressure already thin margins if demand or fuel assumptions do not hold up.
Find out about the key risks to this American Airlines Group narrative.
Another View: What Multiples Say About American Airlines Group
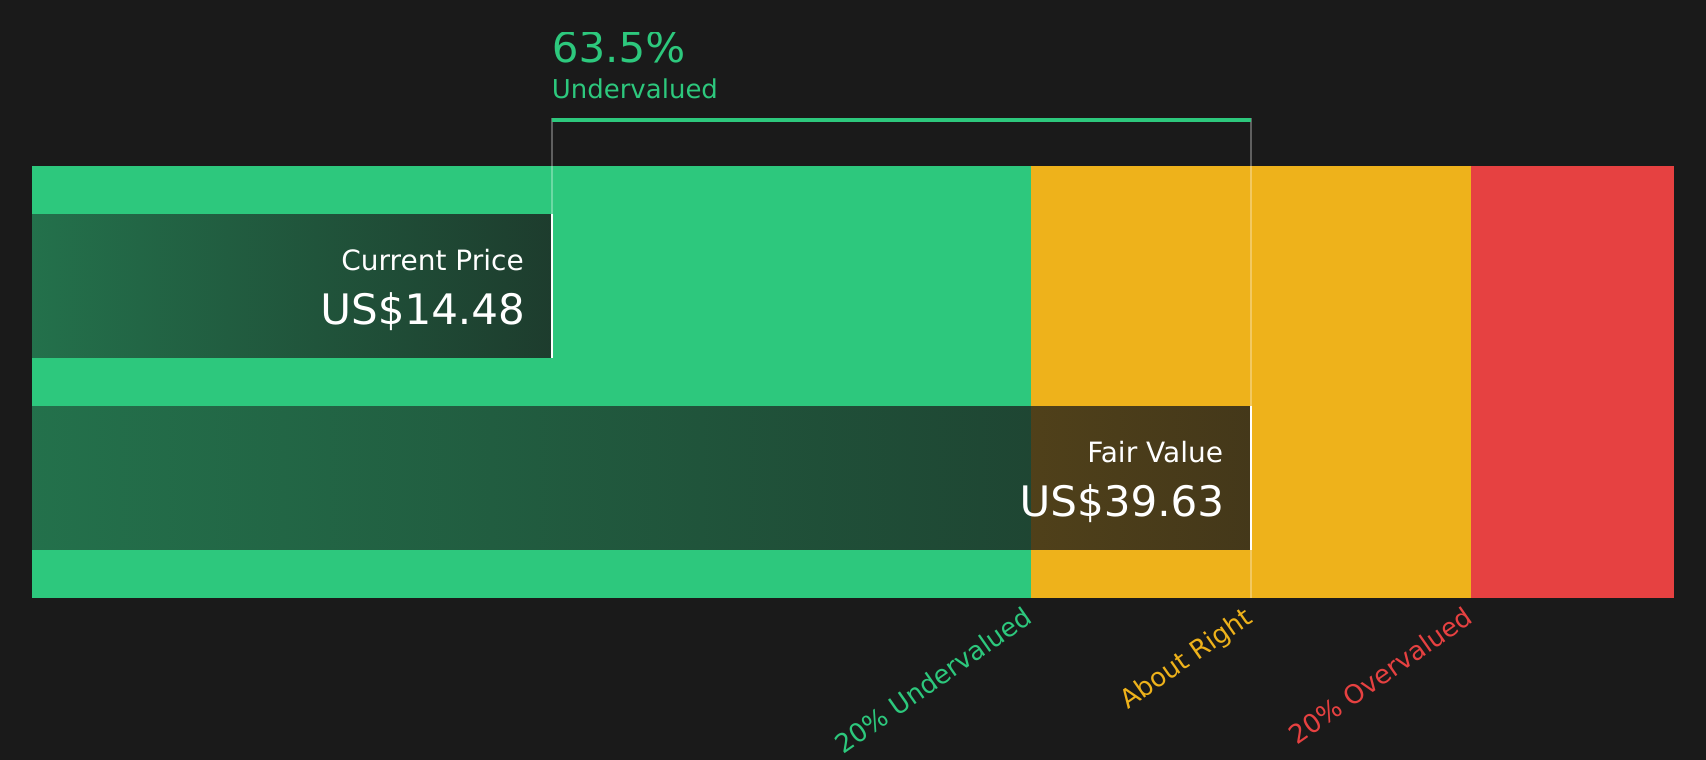
The SWS DCF model points to American Airlines Group trading at a 42.2% discount to an estimated future cash flow value of $23.47, which lines up with the 30.8% undervaluation signal from the analyst fair value. If both cash flows and narratives lean cheap, the key question is how much execution risk you are willing to accept.
Look into how the SWS DCF model arrives at its fair value.
Next Steps
Given the mix of optimism and concern around American Airlines Group, this is a moment to move quickly, review the full picture, and weigh both sides using the 2 key rewards and 4 important warning signs.
Looking for more investment ideas beyond American Airlines Group?
If American Airlines Group has sharpened your focus on valuation and risk, do not stop here. Broaden your watchlist now with targeted, high quality ideas.
- Spot potential underpriced opportunities early and scan through 38 high quality undervalued stocks that pair attractive valuations with solid underlying fundamentals.
- Strengthen your focus on resilience and review 79 resilient stocks with low risk scores that score well on financial health and lower overall risk profiles.
- Get ahead of the crowd and hunt for underfollowed quality using the screener containing 20 high quality undiscovered gems before they appear on everyone else's radar.
This article by Simply Wall St is general in nature. We provide commentary based on historical data and analyst forecasts only using an unbiased methodology and our articles are not intended to be financial advice. It does not constitute a recommendation to buy or sell any stock, and does not take account of your objectives, or your financial situation. We aim to bring you long-term focused analysis driven by fundamental data. Note that our analysis may not factor in the latest price-sensitive company announcements or qualitative material. Simply Wall St has no position in any stocks mentioned.
Have feedback on this article? Concerned about the content? Get in touch with us directly. Alternatively, email editorial-team@simplywallst.com