
- PRICING
- LIVE QUOTES
- LEARN
- HELP


EN
Applied Industrial Technologies (AIT) Stock Looks Fully Priced On Cash Flow And Earnings
Applied Industrial Technologies has delivered a very large 304.9% total return over the past five years, yet current checks suggest the stock may now be trading at a premium, with both its Discounted Cash Flow (DCF) intrinsic value estimate and market multiples pointing to overvaluation.
- Over the last five years, a 304.9% return puts Applied Industrial Technologies among the stronger long term performers, which naturally raises the question of how much of that success is already embedded in the share price.
- Expectations that the company can keep converting growth into dependable cash flows may support the current valuation. Any slowdown in cash generation or rising capital needs could weigh heavily on what investors are willing to pay.
- The stock passes 0 of 6 valuation checks, so the broader assessment on Simply Wall St leans toward Applied Industrial Technologies not being a clear bargain on current metrics, as reflected in its low value score of 0 out of 6.
The issue now is whether Applied Industrial Technologies' current share price still offers enough long term value after such a strong run, given that both intrinsic value estimates and market multiples indicate the stock may be overvalued.
Does Applied Industrial Technologies Look Pricey on Cash Flow?
The Discounted Cash Flow (DCF) model uses Applied Industrial Technologies' projected cash flows to estimate what the stock could be worth today. For the latest twelve months, the company generated free cash flow of about $439.5 million, with analysts and internal estimates assuming that cash flows keep growing rather than shrinking over the coming decade.
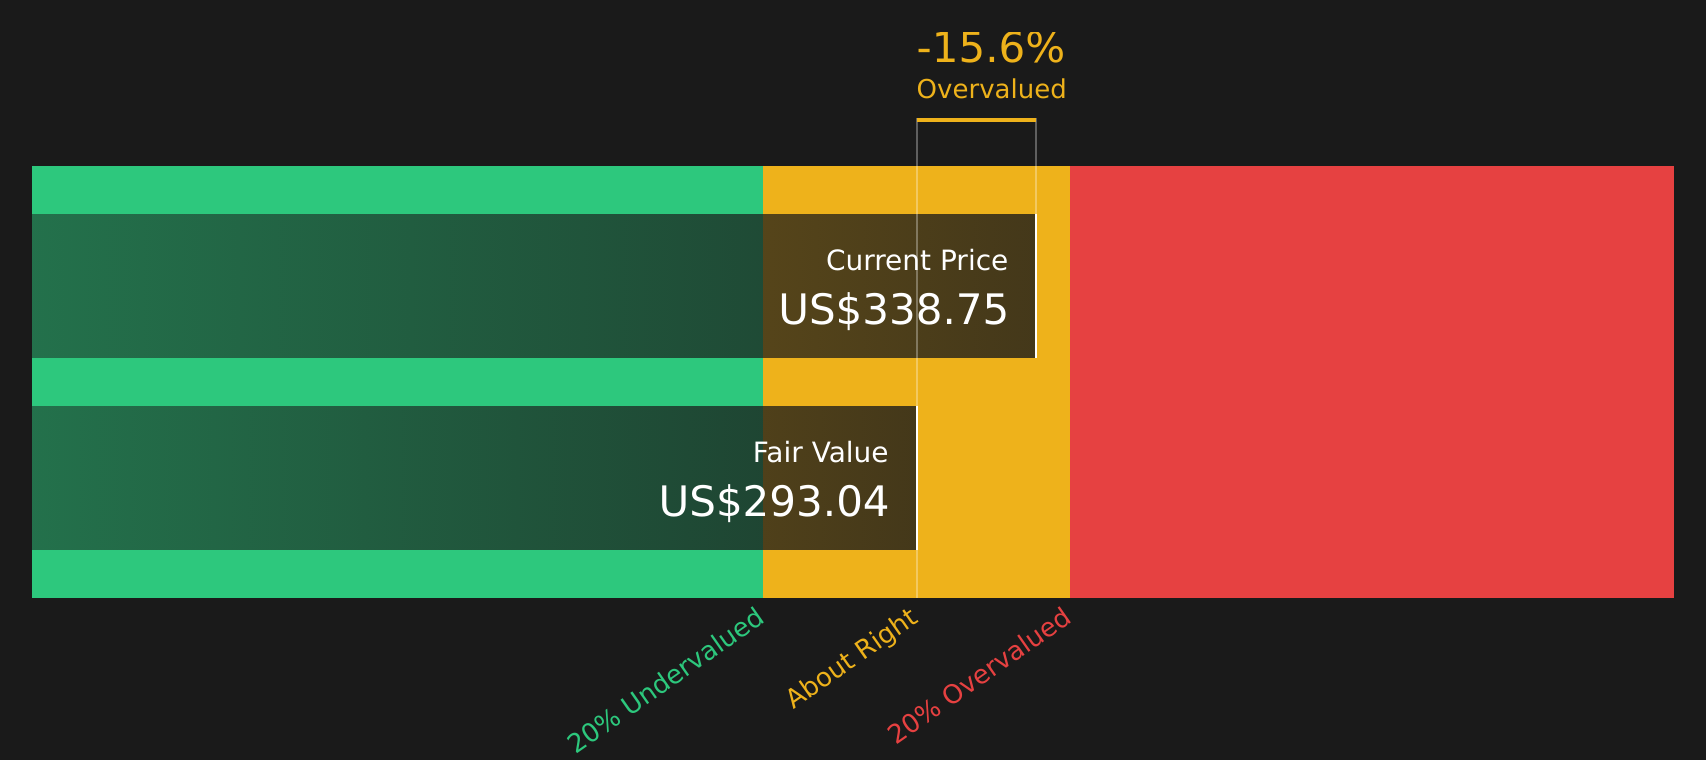
Based on these assumptions, the 2 Stage Free Cash Flow to Equity model points to an estimated intrinsic value of about $286 per share. With the DCF suggesting the stock trades roughly 20.3% above this estimate, the current share price appears higher than what these cash flow projections support.
On this intrinsic value view, Applied Industrial Technologies stock currently screens as overvalued.
Our Discounted Cash Flow (DCF) analysis suggests Applied Industrial Technologies may be overvalued by 20.3%. Discover 38 high quality undervalued stocks or create your own screener to find better value opportunities.
Does Applied Industrial Technologies Look Pricey on Earnings?
The P/E ratio is a useful way to gauge what you are paying today for each dollar of earnings at Applied Industrial Technologies. Right now, the stock trades on a P/E of about 31.5x, compared with an industry average of roughly 24.4x for Trade Distributors and a peer average of about 25.4x, so investors are paying a clear premium to sector and peer benchmarks.
The fair P/E ratio estimate for Applied Industrial Technologies is around 23.6x, based on factors such as its sector, profitability profile, size and risk. That is meaningfully below the current 31.5x multiple, which suggests the stock is pricing in stronger attributes than this framework supports and leaves less room for disappointment if conditions or expectations change.
On this P/E yardstick, Applied Industrial Technologies stock currently appears overvalued.

See what the numbers say about this price — find out in our valuation breakdown.
The Applied Industrial Technologies Narrative: What Would Justify Today's Price?
Simply Wall St Narratives pick up where Applied Industrial Technologies' valuation puzzle leaves off. They spell out which paths for growth, margins and earnings would need to hold for the stock to be worth significantly more or less than today’s price. Each Narrative sets out its view of fair value as a thesis about Applied Industrial Technologies' business that you can revisit over time to see how the story holds up, and they sit on Simply Wall St’s Community page.
If you have a clear, number driven view on where Applied Industrial Technologies' growth, margins and execution go from here, consider adding your own Narrative to the Simply Wall St community and setting out the case you want to track as new results arrive.
Do you think there's more to the story for Applied Industrial Technologies? Head over to our Community to see what others are saying!
The Bottom Line
For Applied Industrial Technologies, both the Discounted Cash Flow (DCF) intrinsic value estimate and the market multiple view currently point in the same direction, with the stock screening as overvalued on each framework. The extremely strong multi year share price move means expectations are already demanding, and the broader valuation checks remain weak despite that strength. From here, the key question is whether Applied Industrial Technologies can keep converting its business into resilient cash flows that justify a premium multiple, or whether any wobble in cash generation or sentiment prompts investors to reassess what they are willing to pay.
This article by Simply Wall St is general in nature. We provide commentary based on historical data and analyst forecasts only using an unbiased methodology and our articles are not intended to be financial advice. It does not constitute a recommendation to buy or sell any stock, and does not take account of your objectives, or your financial situation. We aim to bring you long-term focused analysis driven by fundamental data. Note that our analysis may not factor in the latest price-sensitive company announcements or qualitative material. Simply Wall St has no position in any stocks mentioned.
Have feedback on this article? Concerned about the content? Get in touch with us directly. Alternatively, email editorial-team@simplywallst.com