
- PRICING
- LIVE QUOTES
- LEARN
- HELP


EN
STERIS (STE) Stock Could Be A Bargain On Its 16% Slide
STERIS stock has fallen 15.8% year to date, yet the current Discounted Cash Flow (DCF) intrinsic value estimate still points to meaningful upside relative to the share price, creating a tension between the weak share performance and what the valuation models suggest.
- Year to date, STERIS is down 15.8%, which means recent shareholders are sitting on losses even though the latest intrinsic value work indicates potential upside.
- Expectations that STERIS can continue to generate reliable cash flows may support the intrinsic value estimate, while any pressure on margins or a sustained slowdown in cash generation would be a clear risk to that view.
- Simpler checks show STERIS only passes 2 out of 6 valuation tests. This leans more toward the stock not being a clear bargain on the broader metrics despite the supportive DCF signal, according to this valuation summary.
The issue now is whether STERIS deserves to trade closer to its intrinsic value estimate, or whether the low broader value score and recent share price weakness are warning that the current discount is justified.
Is STERIS a Bargain on Cash Flow?
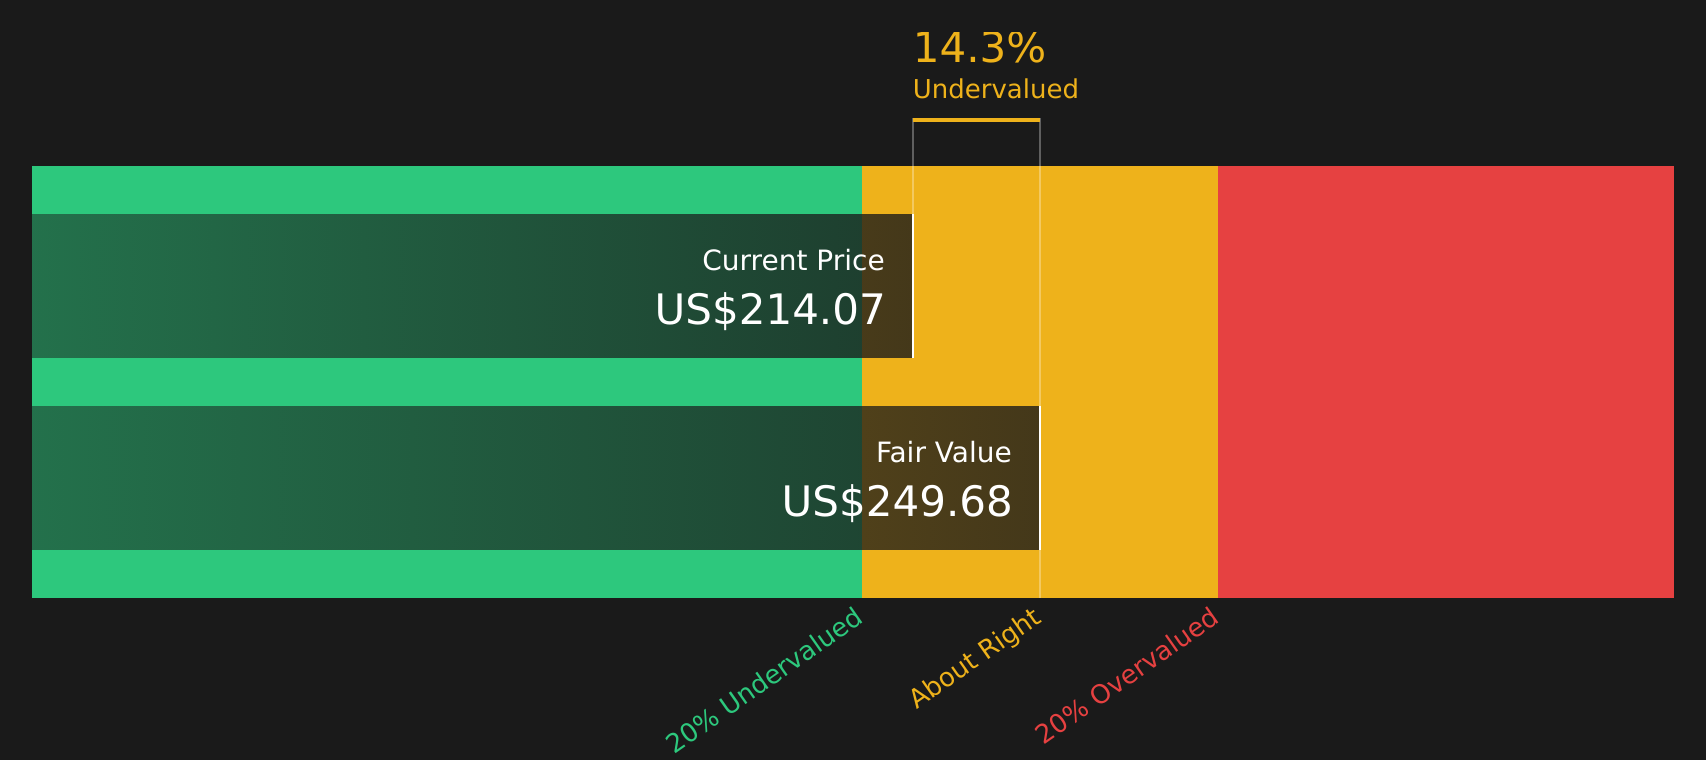
The Discounted Cash Flow (DCF) approach values STERIS by projecting its future cash generation and discounting it back to today. On this model, STERIS is producing latest twelve month free cash flow of about $946.7 million, with the projections assuming broadly growing cash flows rather than a sharp step change.
Those cash flows translate into an estimated intrinsic value of about $249 per share, compared with a market price that implies the stock trades at roughly a 15.4% discount to that estimate. The result is a picture where STERIS screens as undervalued on cash flow, even though it does not look inexpensive on simpler multiples such as P/E or P/S.
Overall, the Discounted Cash Flow analysis indicates that STERIS stock appears undervalued relative to its modeled cash flows.
Our Discounted Cash Flow (DCF) analysis suggests STERIS is undervalued by 15.4%. Track this in your watchlist or portfolio, or discover 38 more high quality undervalued stocks.
Where Does STERIS Sit on Earnings?
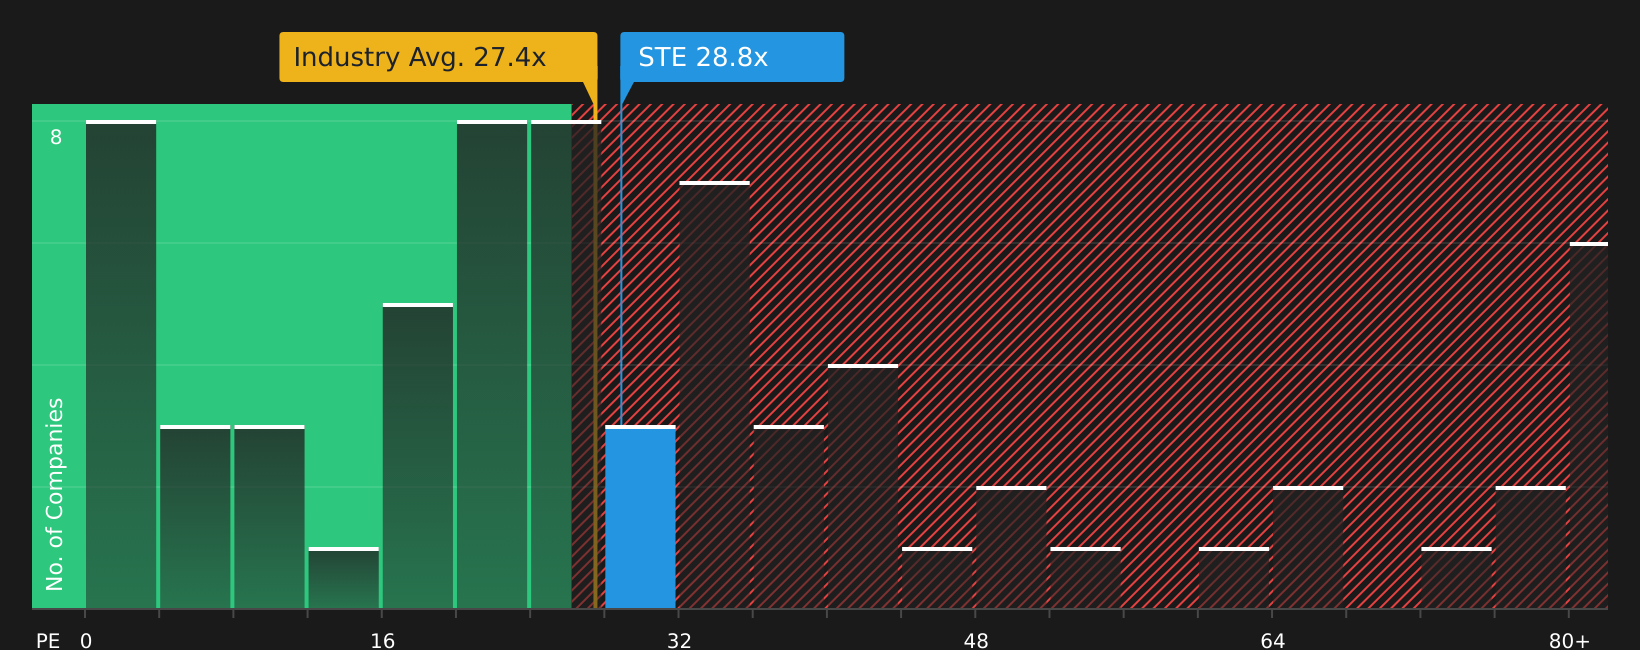
The P/E ratio is a useful cross-check for STERIS because it anchors the share price to the earnings the business is currently producing. STERIS trades on a P/E of about 26.2x, which is close to the Medical Equipment industry average of roughly 26.4x and modestly above the peer group average of about 21.3x. On raw market comparisons, the stock does not screen obviously cheap, but it also does not sit at an extreme premium to its sector.
The fair P/E ratio estimate for STERIS is around 24.8x, which reflects what investors might reasonably pay given its size, margins and risk profile. That is only slightly below the current multiple, so the gap is relatively small and does not suggest a strong discount or an aggressive premium. Taken together with the industry and peer checks, STERIS appears broadly aligned with where similar stocks trade on earnings.
Putting the P/E work together, STERIS stock appears roughly fairly valued on its earnings multiple.
See what the numbers say about this price — find out in our valuation breakdown.
The STERIS Narrative: What Would Justify Today's Price?
Simply Wall St Narratives aim to connect STERIS' current valuation puzzle with clear, quantified views of what its future growth, margins and earnings would need to look like for the stock to be worth materially more or materially less than today's price. Each narrative links its number to a specific view on how STERIS' growth, profitability and risks might evolve, giving you something concrete to revisit on the Community page as new information comes through.
If you have a clear, number-driven view on where STERIS' growth, margins and execution go from here, share a Narrative and put your case on the record for others to weigh against the current valuation.
It is a chance to add your voice to the Simply Wall St community, spell out the assumptions behind your outlook, and track how your thesis holds up as new results come through.
Do you think there's more to the story for STERIS? Head over to our Community to see what others are saying!
The Bottom Line
For STERIS, the Discounted Cash Flow (DCF) work points to intrinsic value above the current share price, while the market multiple view suggests the stock is priced roughly in line with peers. That gap reflects a classic tension between what its cash generation could be worth over time and what investors are currently prepared to pay based on earnings comparisons. With broader valuation checks scoring weakly, the key question is whether STERIS can sustain the cash flows implied in the intrinsic value estimate or whether the current discount is simply the market pricing in the risk that margins and cash generation come under pressure.
This article by Simply Wall St is general in nature. We provide commentary based on historical data and analyst forecasts only using an unbiased methodology and our articles are not intended to be financial advice. It does not constitute a recommendation to buy or sell any stock, and does not take account of your objectives, or your financial situation. We aim to bring you long-term focused analysis driven by fundamental data. Note that our analysis may not factor in the latest price-sensitive company announcements or qualitative material. Simply Wall St has no position in any stocks mentioned.
Have feedback on this article? Concerned about the content? Get in touch with us directly. Alternatively, email editorial-team@simplywallst.com