
- PRICING
- LIVE QUOTES
- LEARN
- HELP


EN
Cui Dongshu: In June, China's automobile exports achieved a 73% year-on-year increase, and the month-on-month trend exceeded expectations for positive growth
The Zhitong Finance App learned that Cui Dongshu, Secretary General of the Passenger Transport Association, released an analysis of China's automobile export market from January to June 2026. From January to June 2026, Chinese automobiles exported 5.31 million vehicles, a growth rate of 53% compared to the same period in 2025. In June, Chinese automobiles exported 1.07 million vehicles, up 73% year on year, up 8% month on month. The year-on-year trend was generally strong, and the month-on-month trend exceeded expectations. The main drivers this year are still high oil prices and the increasing competitiveness of Chinese products and the continued growth of the global southern markets.
The top 10 countries of China's total automobile exports in June 2026: Russia 84,451, Britain 62487, Australia 60,510, Belgium 59,606, Philippines 46,243, Mexico 45,528, Algeria 33,358, Thailand 29,923, Malaysia 26,767, Brazil 25,856. Among them, the top five that increased over the same period were: Russia 58053, Australia 41,065, Belgium 35070, the United Kingdom 33,913, and the Philippines 21,358. In the Russian market, Chinese car companies' awareness of risk prevention has increased, and exports to remove inventory in 2025 will be very strong. Our exports to Russia recovered significantly from January to June 2026.
The top 10 countries with cumulative total vehicle exports from January to June 2026: Brazil 448,157, Brazil 410,825, United Kingdom 25,5260, Australia 23,7823, Belgium 219730, Mexico 210,155, Italy 15,4870, Philippines 148,727, UAE 14,3012, Algeria. Among them, the top five that increased over the same period were: Russia 267411, Brazil, 118,848, Algeria 100,382, Australia 94368.
In June 2026, China exported 529,000 new energy vehicles, up 108% year on year. The cumulative export performance from January to June was 2.42 million units, an increase of 70%. The performance of NEV exports in June was strong compared to May. In June 2026, pure electric vehicles accounted for 30% of China's automobile exports (YoY 0%), hybrid accounts for 19% (YoY +8%), hybrids accounted for 7% (+1% YoY), and pure fuel vehicles accounted for 35% (YoY -8%).
China's top 10 NEV exports in June 2026: Belgium 57,217, UK 50,157, Australia 46,434, Philippines 43,466, Thailand 28,978, Germany 17,900, Spain 14,974, South Korea 13,764, Malaysia 12399, and Brazil 11089. Among them, the top five that increased over the same period were: Australia 34736, Belgium 33,277, the UK 31305, the Philippines 24,927, and Thailand 20,980.
The top 10 countries with total NEV exports from January to June 2026: Brazil 29,9803, Belgium 209,217, UK 181,260, Australia 167126, Thailand 126,646, Philippines 12,6062, Germany 84190, Italy 79,503, South Korea 75430, Spain 72723. Among them, the top five that increased over the same period were: Brazil 183,399, Australia 98,744, UK 89,216, Thailand 66297, Belgium 63,953 vehicles.
China's NEV export performance from January to June 2026 was better than expected. Mainly, hybrid and hybrid vehicles replaced pure electric vehicles as a new growth point for export growth. In particular, the export performance of pure electric trucks was strong, which became a bright spot for commercial vehicle NEV exports, and the recovery in capacity contributed to a sharp increase in exports in June. China's NEV exports are mainly exported to Western Europe, Central and South America, and the Middle East market is blocked.
I. Overall trend of China's automobile exports
1. Trends in automobile exports over the years
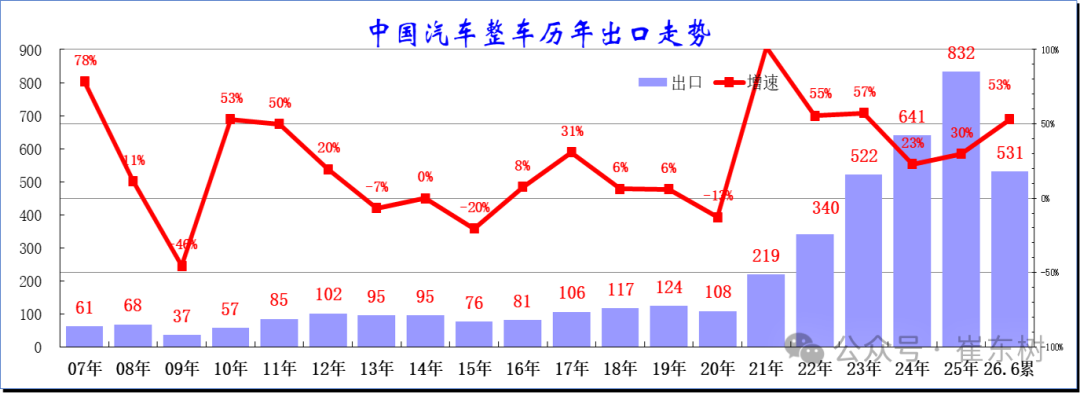
China's automobile exports achieved a breakthrough in 2021 after years of multi-million platform periods. In the context of the downturn in the world economy from 2013 to 2016, automobile exports declined sharply. From 2017 to 2020, the export growth rate gradually stabilized and improved, and the annual export volume remained at around 1 million vehicles. Exports reached 1.08 million vehicles in 2020, down 13% year on year, and then entered a period of high growth since 2021.
China's automobile exports have continued to grow at a high rate since breaking through the millionth level in 2021 (up 102% in 2021, 50% + in 2024-2023, and falling back to around 30% in 2024-2025), and 5.31 million vehicles were exported from January to June 2026 (up 53% from 2025), continuing the growth trend. Recently, China's automobile exports have shown a rapid growth trend. In the future, as long as the international market environment is stable, there is still huge room for development of Chinese automobile exports.
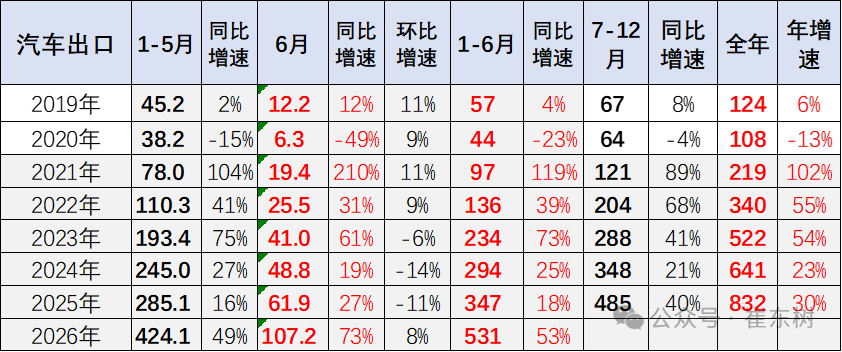
From January to June 2026, China achieved exports of 5.31 million vehicles, a growth rate of 53% over the same period in 2025. In June, China exported 1.07 million vehicles, up 73% year on year, up 8% month on month. The year-on-year trend was generally strong, and the month-on-month trend exceeded expectations. The main drivers this year are still high oil prices and the increasing competitiveness of Chinese products and the continued growth of the global southern markets.
Judging from monthly trends, China's automobile exports in recent years are still showing seasonal characteristics, which are characterized by a trend that contrasts with rising summer and domestic trends. The export growth rate was relatively strong from January to June 2026, mainly due to the slump in the domestic market, and the increasing momentum and ability of enterprises to respond to overseas markets.
2. Monthly trend of vehicle exports
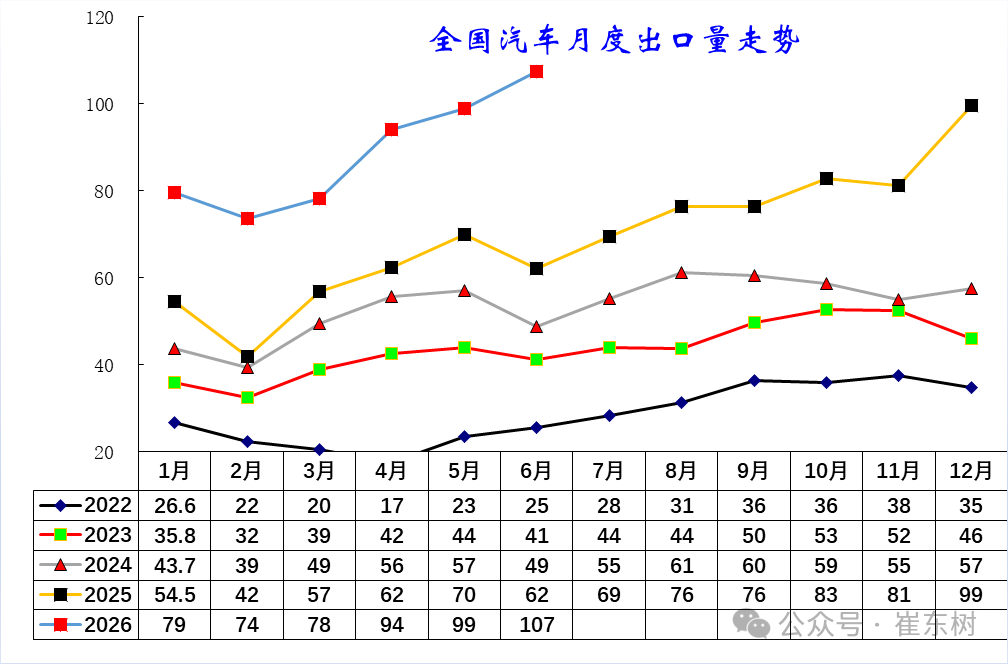
Judging from the monthly trend, China's automobile exports in recent years are still characterized by continuous strengthening of inertia. Recently, they have shown a trend in contrast between higher exports and domestic downturn. The export growth rate from January to June 2026 was relatively strong, continuing the momentum of continuous growth. Despite the outbreak of the US-Iran war, due to market fragmentation, the growth rate of China's automobile exports was less affected by the external environment and continued to rise since 2026.
3. Structural characteristics of automobile exports
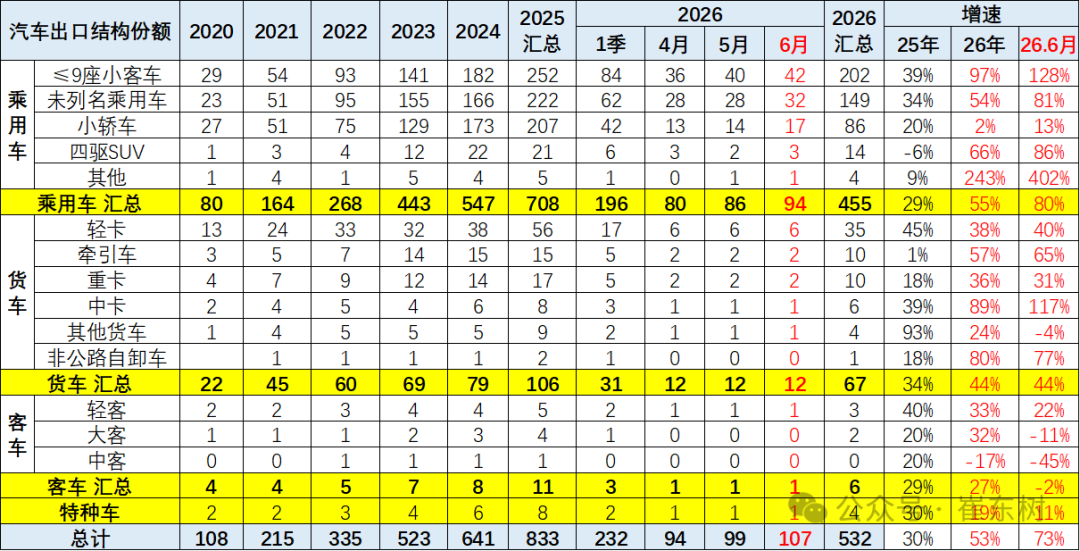
China's automobile exports remained at the scale of one million before 2020, and then continued to grow rapidly to 8.33 million vehicles in 2025. Passenger car exports continued to strengthen, and truck and bus exports also continued to grow well.
The growth rate of various types of customs vehicles has diverged throughout this year. The growth rate of passenger cars has gradually rebounded to 55%. The growth rate of trucks is slower than that of passenger cars. Truck exports have increased 44%. Compared with the steady trend of domestic fuel trucks, electric truck exports have been relatively good recently.
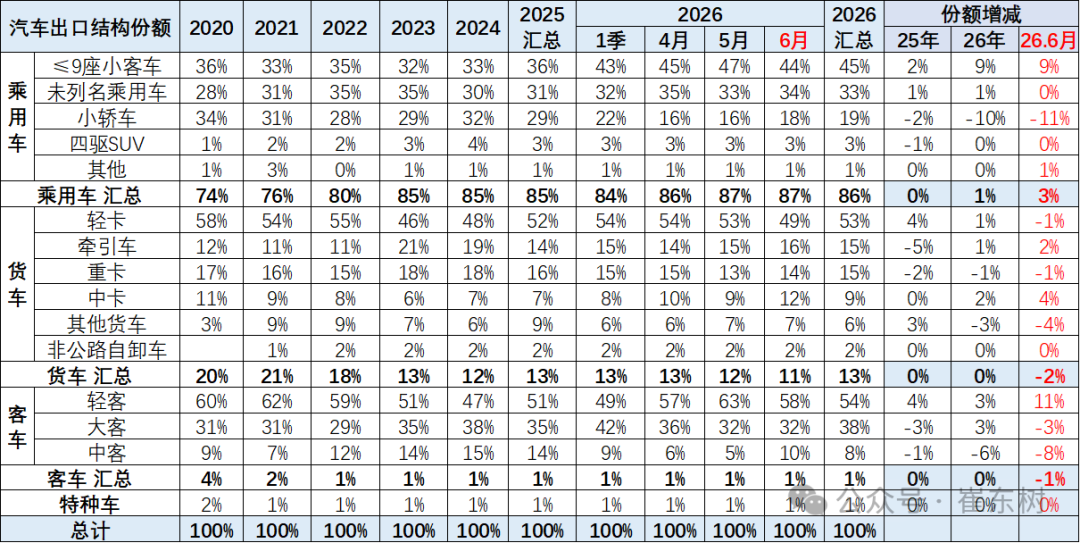
In terms of structure, the share of passenger car exports gradually stabilized, reaching 85% by 2023, and then relatively stable. Truck exports have increased markedly due to electric trucks. The share of bus exports has continued to fall to a low level in recent years. Since passenger cars are the focus of trade, the overall proportion of trucks and buses exported reached 14%, which is slightly higher than the share of domestic commercial vehicles.
The performance of several major passenger car categories is more balanced. Passenger car exports in 2026 are minibuses with 9 seats or less, and buses with 9 seats or less account for 45% in 2026, of which it reached 44% in June. Although the impact of the decline in Tesla exports was significant, exports of autonomous electric vehicles grew better in June.
The share performance of trucks in June was poor. Pickup truck growth increased in June, heavy truck export performance declined to a high level, and other truck markets showed strong trends. Among buses, the performance of large and medium-sized buses was weak, and the share of light bus exports fell slightly in June.
4. Structural characteristics of export dynamics
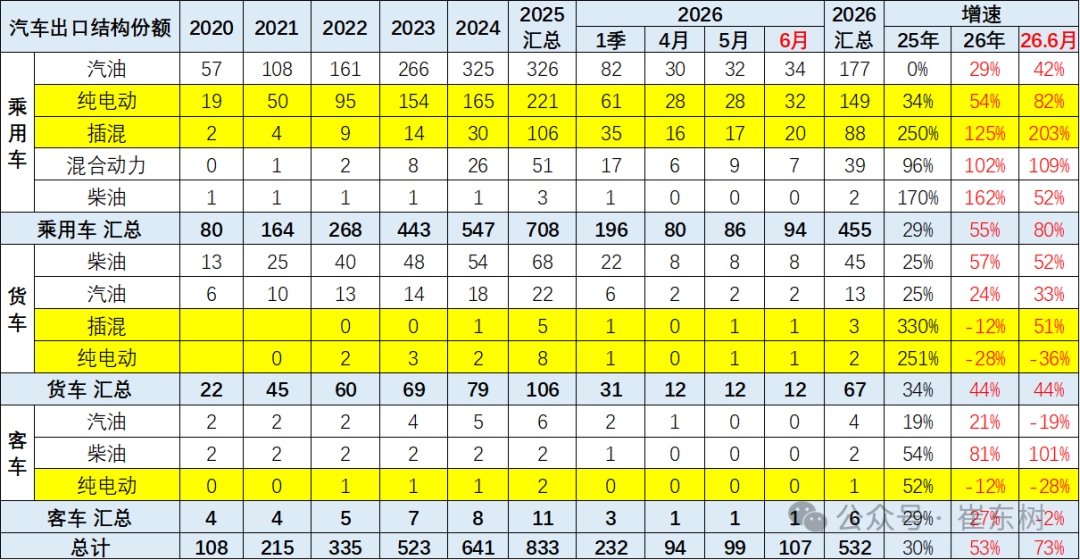
In terms of export power structure characteristics, the export growth rate of passenger cars declined significantly in 2025. Among them, gasoline vehicle exports all grew at a low rate. This year, exports of hybrid passenger cars were very strong, while plug-in passenger car exports grew the strongest. Exports of trucks and buses have been stable this year, and fluctuations in passenger car exports to Russia and Europe are the core drivers of growth.
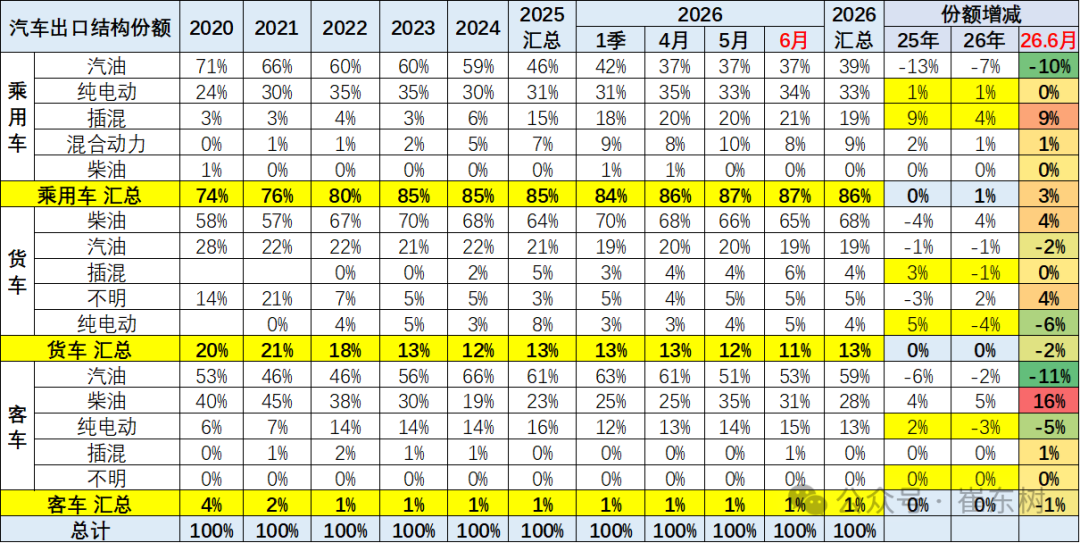
From January to June 2026, the share of new energy in passenger cars rebounded, the share of fuel vehicles dropped significantly, and hybrids rose to prominence. Exports of gasoline passenger cars, diesel trucks, and gasoline buses have declined significantly. Exports of plug-in hybrid passenger cars, pure electric trucks, and hybrid passenger cars grew relatively well in June.
II. The pattern of the automobile export market
1. Domestic regional characteristics of export manufacturers
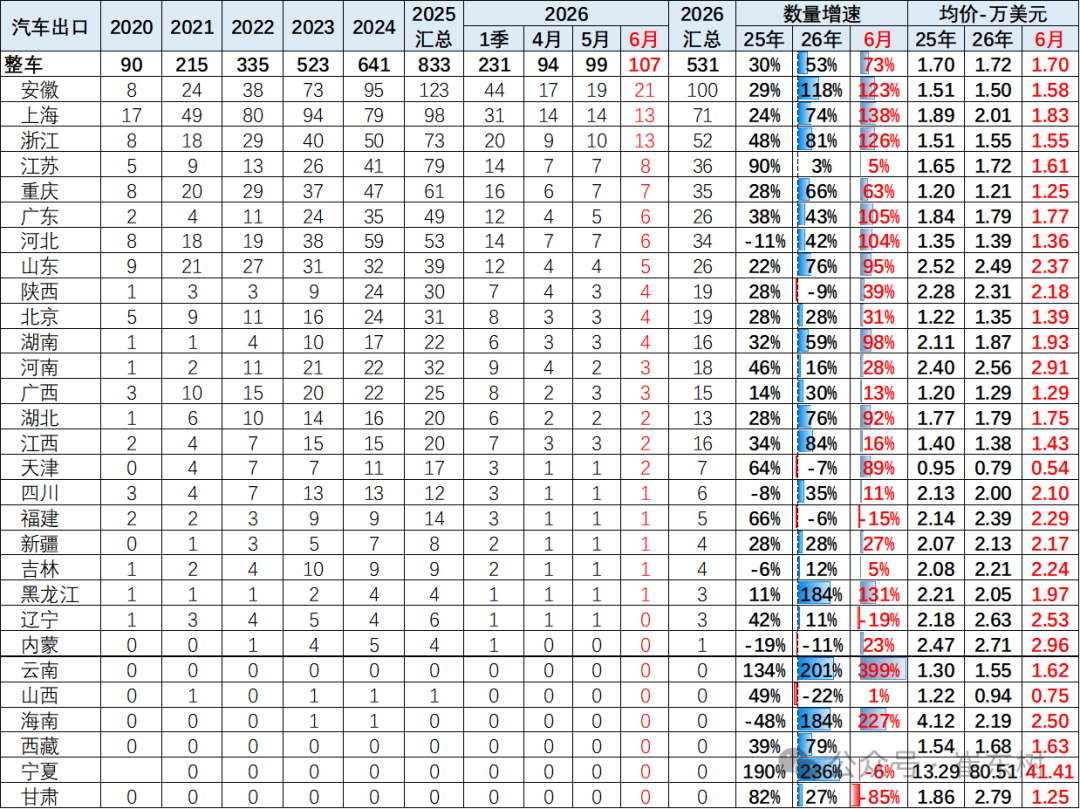
The leading national automobile export position in Shanghai, which began in 2024, was replaced by Anhui, and in 2026, Anhui will maintain the number one export position. The importance of Shanghai's exports to China is extremely obvious. In fact, it is a leader with long four corners, and the radiation effect is strong. From January to June 2026, Anhui exported 1 million vehicles. This was mainly due to the relatively excellent local enterprises in Anhui, and companies such as BYD settled in Hefei. Shanghai companies have a high export grade. SAIC Motor and Tesla companies have a high average export price.
Anhui's export performance has been relatively strong in the past two years. Mainly, the export performance of Chery and JAC is relatively strong, but the Russian market has fluctuated greatly, so Anhui's exports have diversified quite well recently. The contribution of automobile exports from Chongqing, Shandong, and Jiangxi increased significantly in 2026.
2. Export area characteristics
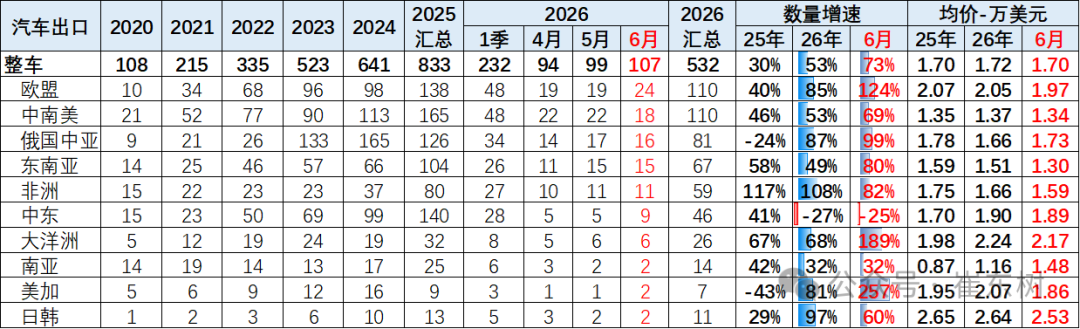
The overall performance of China's automobile exports was strong. Among them, the EU and Africa surged, and exports to Japan, South Korea, Africa, and Oceania performed relatively well. Meanwhile, there is a lot of pressure on export performance in Southeast Asia and Oceania.
Earlier, China's automobile exports accounted for a high share in Central and South America and the European Union, and other regions of Asia, such as Southeast Asia and South Asia, showed strong performance. Currently, it is gradually shifting to the relatively strong characteristics of Central and South America, Europe, Russia, and Central Asia, and exports from Japan, South Korea, and the US have also improved. In particular, June was affected by the US-Iran war, and exports to the Middle East were clearly blocked.
3. Analysis of vehicle export trends by country
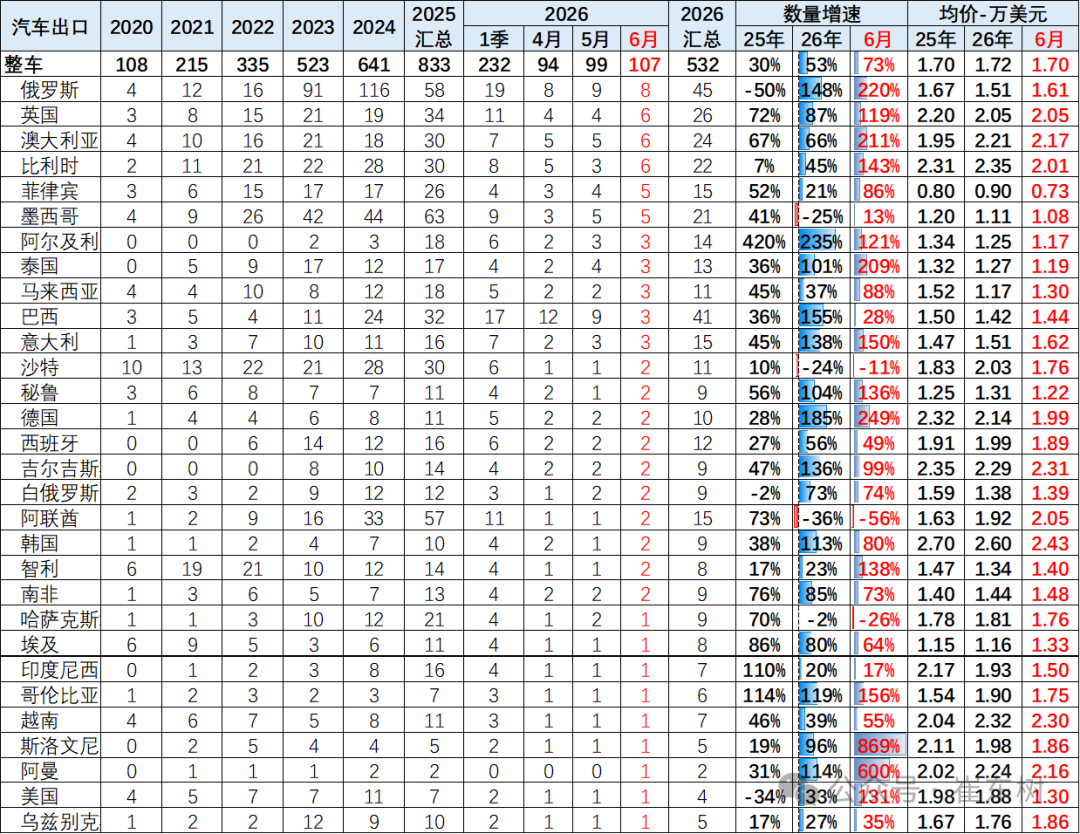
The decline in the average export price is conducive to export growth. As the RMB appreciates, the US dollar export price remains stable, and China's automobile export prices will be more competitive in 2026. The Russian market changed dramatically in the early stages, and other foreign investors withdrew. As a result, China has also exported a lot to Russia since 2023, removed inventory in 2025, and returned to normal in 2026. Last year, more cars were exported to Belgium. Relations with Europe have improved this year, and export performance has also improved.
In June, our exports to the UAE market fell 56%, and Saudi Arabia fell 11%.
Recently, the Brazilian market has performed well, and Chinese automobiles have achieved certain results by entering the local construction of factories. Car markets such as Peru and Thailand have recovered this year.
4. Monthly trend of increase or decrease in vehicle exports
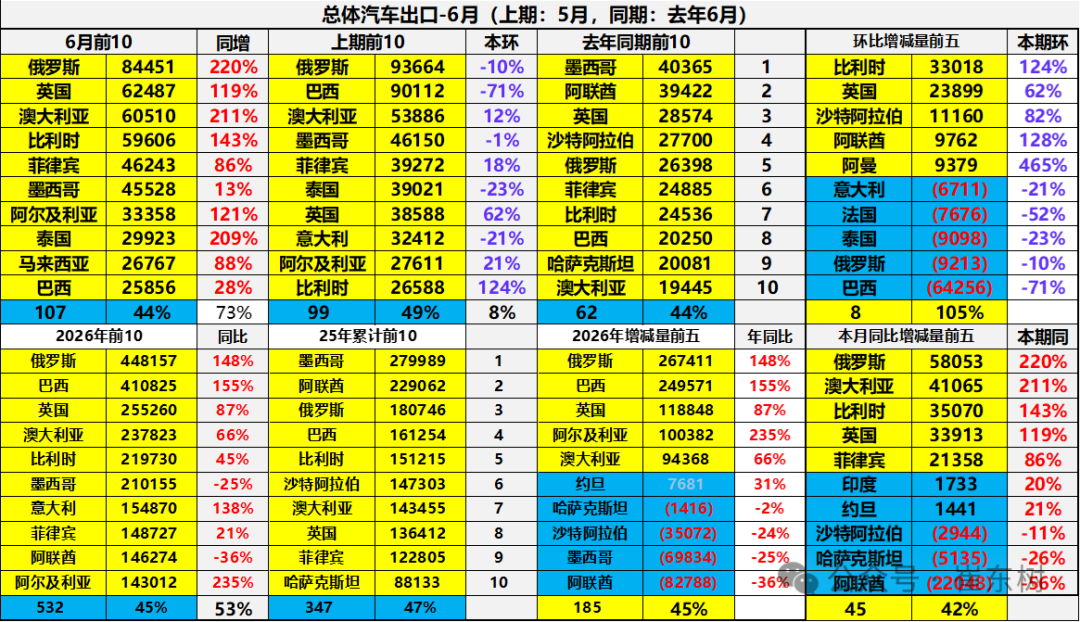
The top 10 countries of China's total automobile exports in June 2026: Russia 84,451, Britain 62487, Australia 60,510, Belgium 59,606, Philippines 46,243, Mexico 45,528, Algeria 33,358, Thailand 29,923, Malaysia 26,767, Brazil 25,856. Among them, the top five that increased over the same period were: Russia 58053, Australia 41,065, Belgium 35070, the United Kingdom 33,913, and the Philippines 21,358.
In the Russian market, Chinese car companies' awareness of risk prevention has increased. Domestic sales in Russia did not decline much in 2025, but we are making great efforts to export and remove inventory. Our exports to Russia recovered significantly from January to June 2026.
The top 10 countries with cumulative total vehicle exports from January to June 2026: Brazil 448,157, Brazil 410,825, United Kingdom 25,5260, Australia 23,7823, Belgium 219730, Mexico 210,155, Italy 15,4870, Philippines 148,727, UAE 14,3012, Algeria. Among them, the top five that increased over the same period were: Russia 267411, Brazil, 118,848, Algeria 100,382, Australia 94368.
5. Analysis of changes in major exporting countries over the years
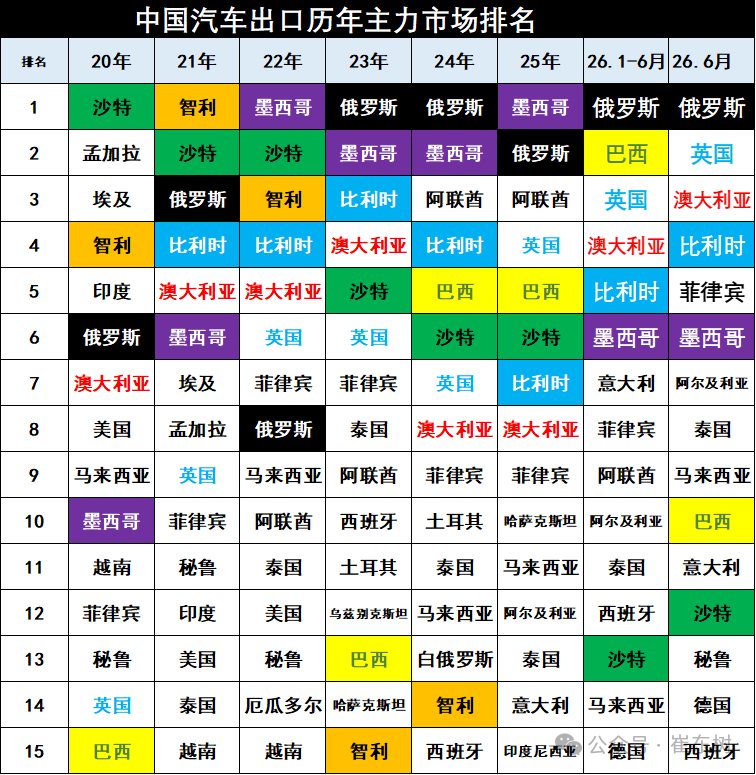
The results of overseas bases for automobile exports in the early stages were not ideal, and the main market fluctuated greatly. The main markets for automobile exports from 2023 to 2024 are from Russia, Mexico, Belgium, Australia, Saudi Arabia, the United Kingdom, etc., with strong trends in the European and American markets. Recently, performance has improved compared to developed countries such as Belgium and the United Kingdom.
The structure of automobile exports changed from January to June 2026, and Russia recovered to the top position of exports. The British market grew strongly, and the UAE's exports fell significantly year on year. Exports to the UAE plummeted in June, and Russian exports performed well.
6. Analysis of changes in exports to Russia
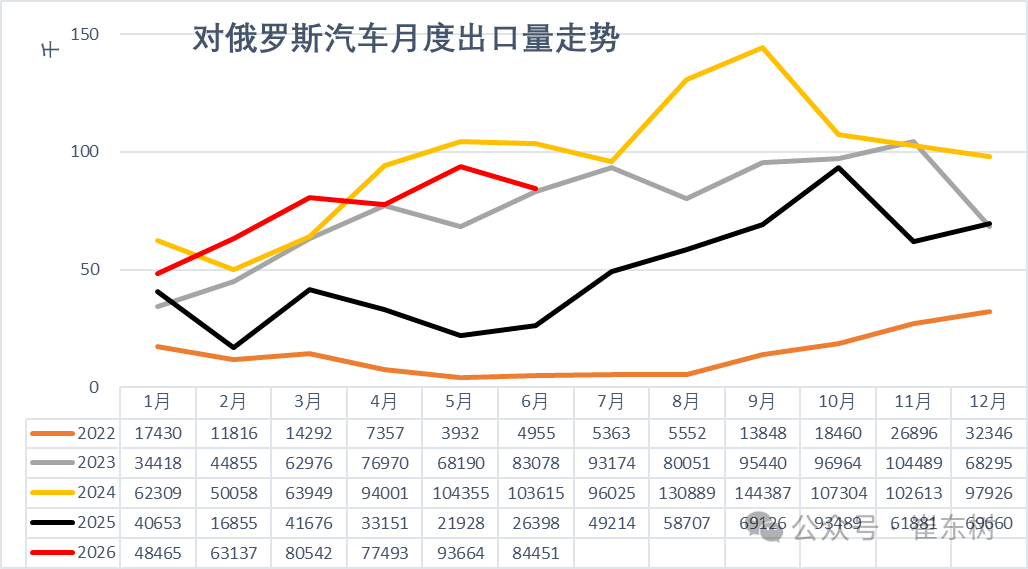
Due to the recent withdrawal of automobile companies from other countries from Russia, Chinese car companies quickly guaranteed Russia's vehicle supply demand in 2023. Early Chinese car companies should be safe in Russia for the time being.
Russia's import rules are continuously adjusted according to supply and demand. Russian car sales in 2024 are already at the highest level in recent years, so a decline in 2025 after demand is overdrawn ahead of schedule is inevitable. Since 2025, China's exports of new energy vehicles to Russia have fluctuated sharply. Domestic demand in Russia has gradually stabilized throughout this year, and Chinese automobile exports are gradually picking up.
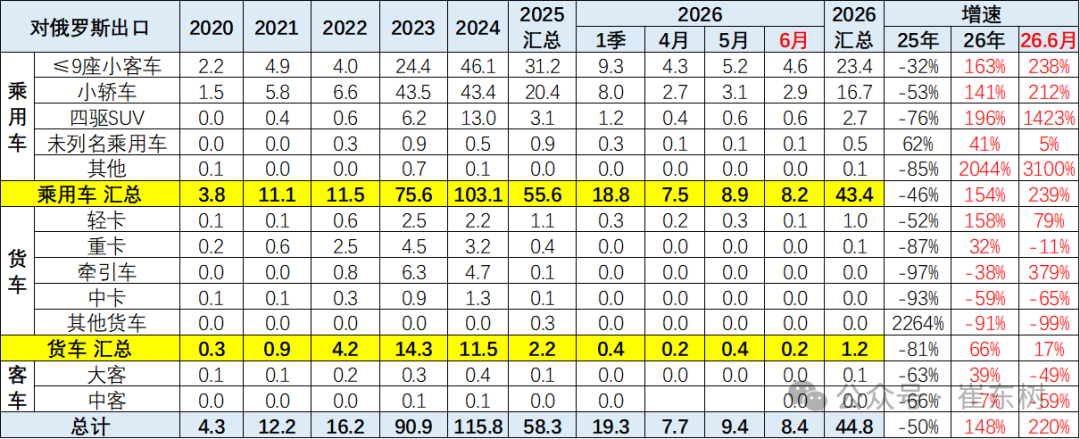
Since 2023, Russia has suddenly become the largest market for Chinese automobile exports. This is another dramatic change in Chinese automobile exports after a lapse of 15 years. Chinese independent brands entered the Russian market in 2008 and performed well, but with Russia's policy of imposing huge tariffs on Chinese cars, Chinese car companies left Russia on a large scale back then. The decline in the first half of 2025 was somewhat similar to 2009, but the beginning of 2026 surged due to a low base.
III. Export trends of new energy vehicles
1. Characteristics of NEV exports over the years
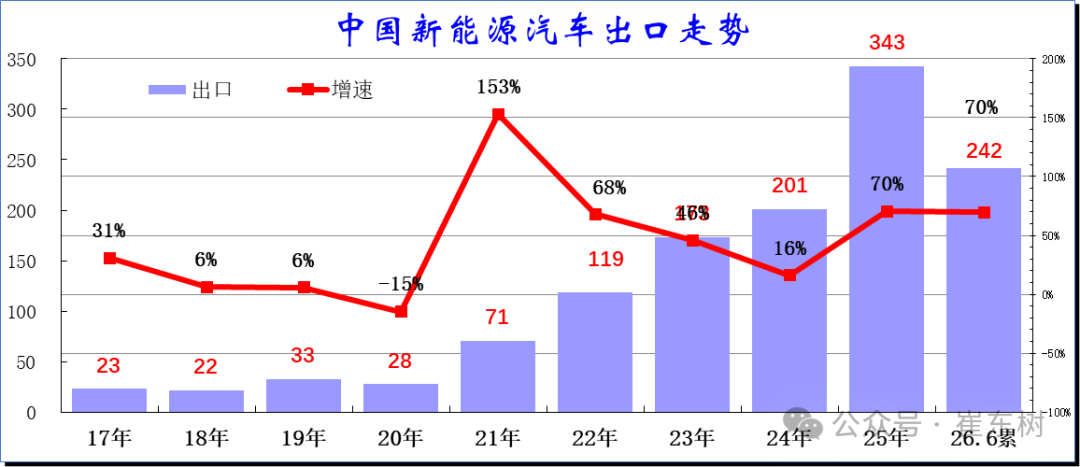
With the transformation of China's domestic NEV market from subsidy-driven to market-driven, China's NEV market competitiveness has increased dramatically. China's NEV exports have exploded since 2021, then entered a continuous high growth range. Despite being disrupted by the EU's NEV export policy in 2024, China's NEV exports still reached 201 million units in 2024, an increase of 16% over the previous year. In 2025, 3.43 million new energy vehicles were exported, an increase of 70% over the previous year, and the performance was good. From January to June 2026, 2.42 million new energy vehicles were exported, an increase of 70% over the previous year, and the performance was good.
2. Monthly export characteristics of new energy vehicles over the years
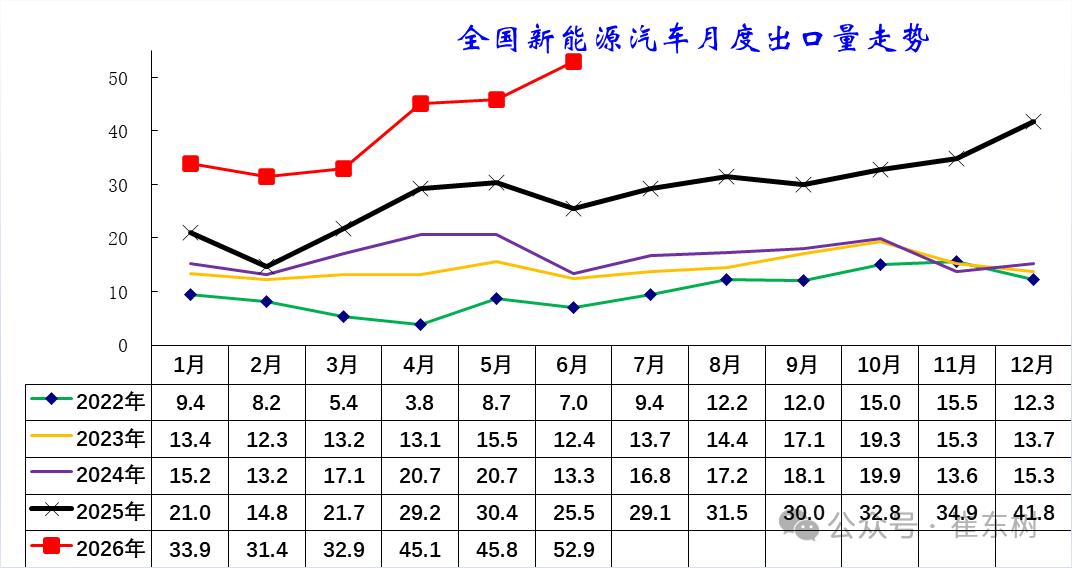
Due to the imposition of tariffs by the European Union, the trend of China's new energy exports was sluggish in the second half of 2024, and the market pressure was high. The trend of a sharp increase in exports of new energy vehicles, which began in March 2025, is extremely strong. From January to June 2026, new energy exports continued to be at an all-time high, and the domestic downturn drove export enthusiasm even higher.
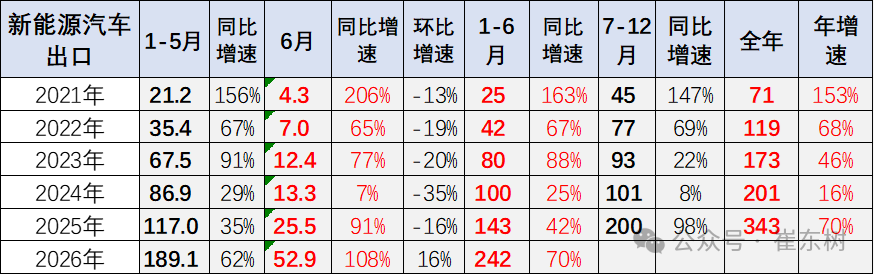
After continuous high growth, the cumulative export volume of new energy vehicles in 2024 was 201 million units, an increase of 16% over the previous year. In 2025, exports of new energy vehicles were 3.43 million units, an increase of 70% over the previous year, and the growth rate was more than 16% higher than the full year of 2024. In June 2026, China exported 529,000 new energy vehicles, up 108% year on year. The cumulative export performance from January to June was 2.42 million units, an increase of 70%. The performance of NEV exports in June was strong compared to May.
3. Changes in the structure of automobile exports
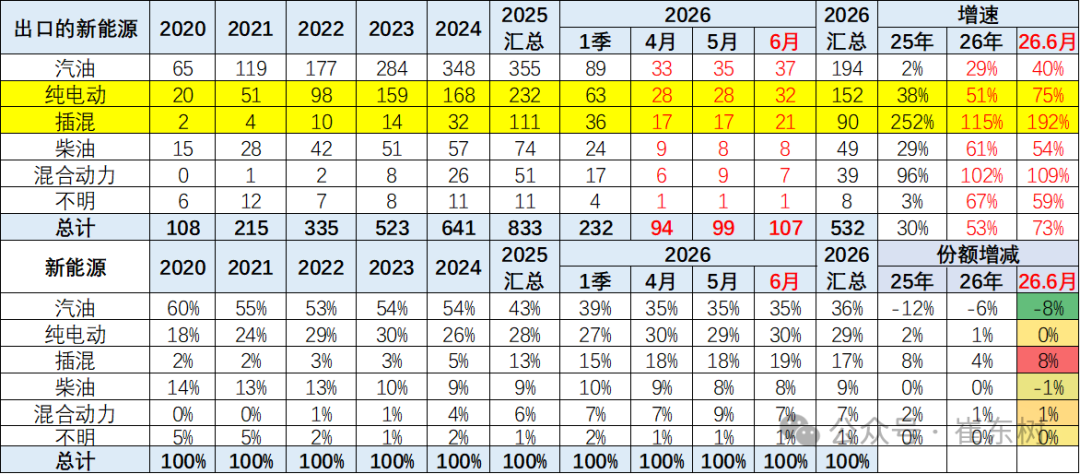
In June 2026, pure electric vehicles accounted for 30% of China's automobile exports (YoY 0%), hybrid accounts for 19% (YoY +8%), hybrids accounted for 7% (+1% YoY), and pure fuel vehicles accounted for 35% (YoY -8%).
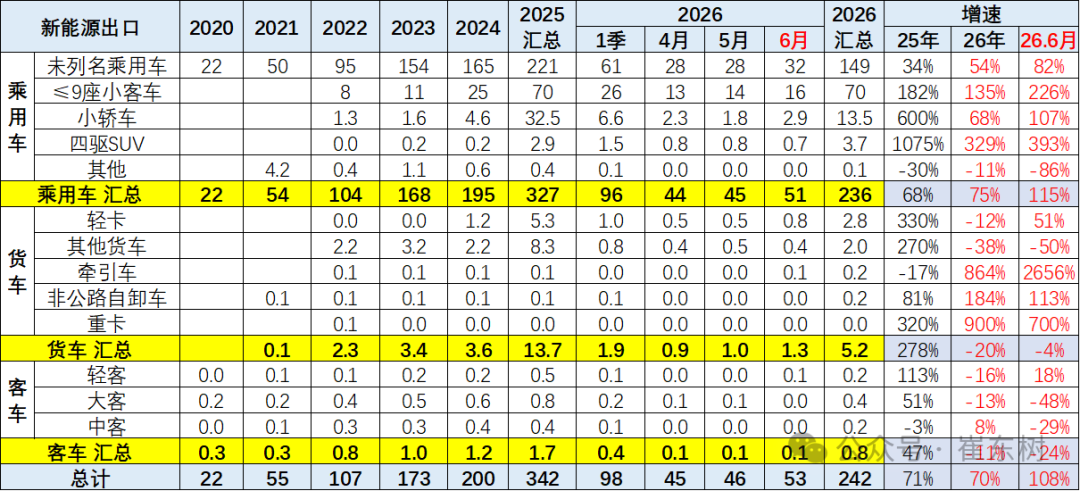
96% of NEV exports are passenger cars. Commercial vehicles account for a relatively small share, and NEVs perform better than buses. The share of unlisted passenger cars due to electrification remains high.
4. Analysis of regional changes in new energy exports
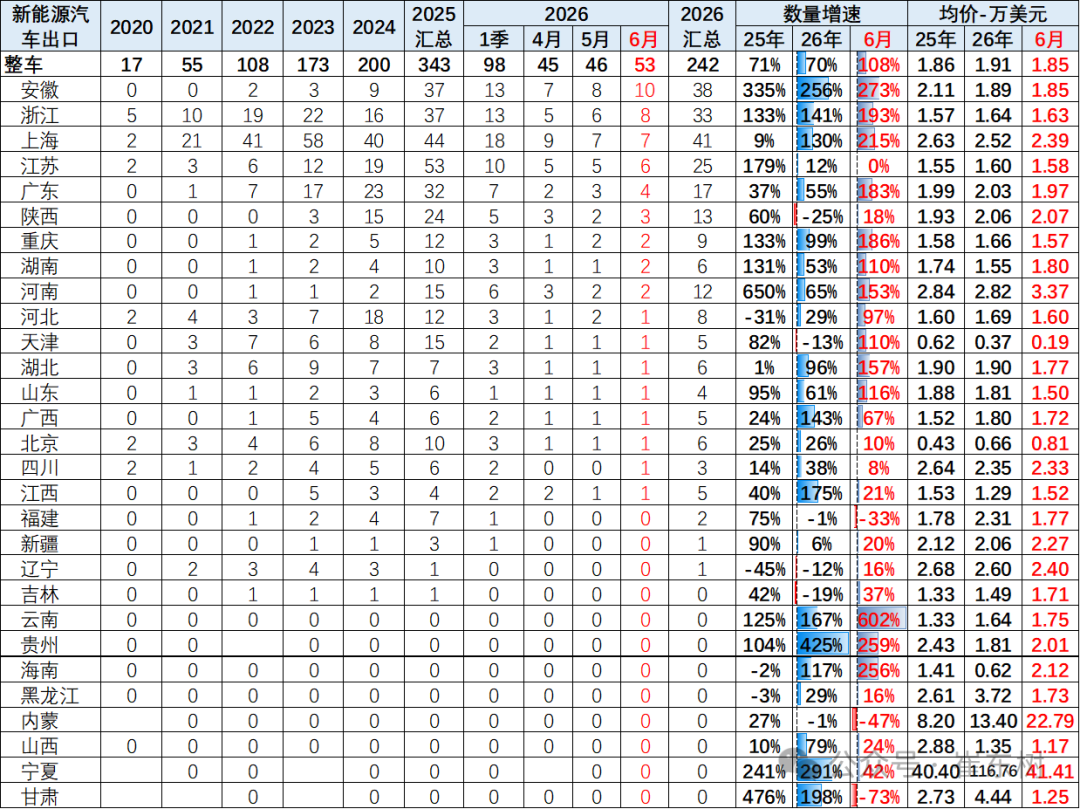
As Tesla entered China, China's automobile export pattern changed. In previous years, Shanghai ranked first for a long time. With the rise of domestic cars, they have independently become the core of new energy exports. Recently, Anhui and others have risen, and new energy exports from Anhui, Zhejiang, Shanghai, and Jiangsu performed well in June.
The average export price of new energy vehicles is relatively stable in 2026.
5. National characteristics of NEV passenger vehicle exports over the years
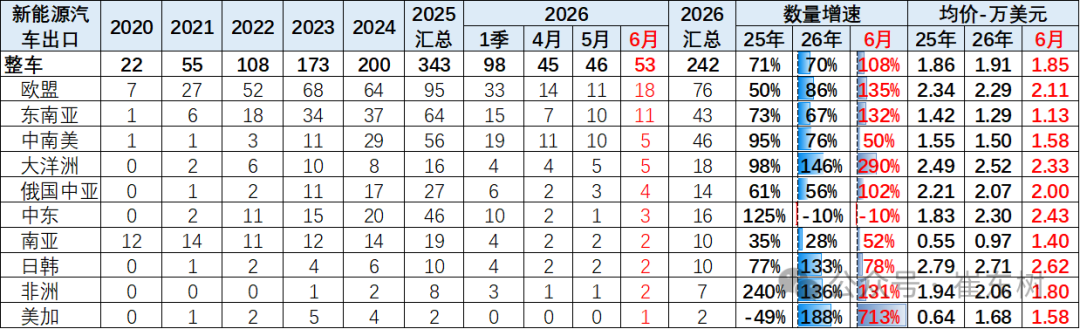
New energy vehicle exports have achieved more breakthroughs. 2026 is still the strongest in the EU. Japan and South Korea have shown high growth rates, and Southeast Asia is still growing relatively steadily.
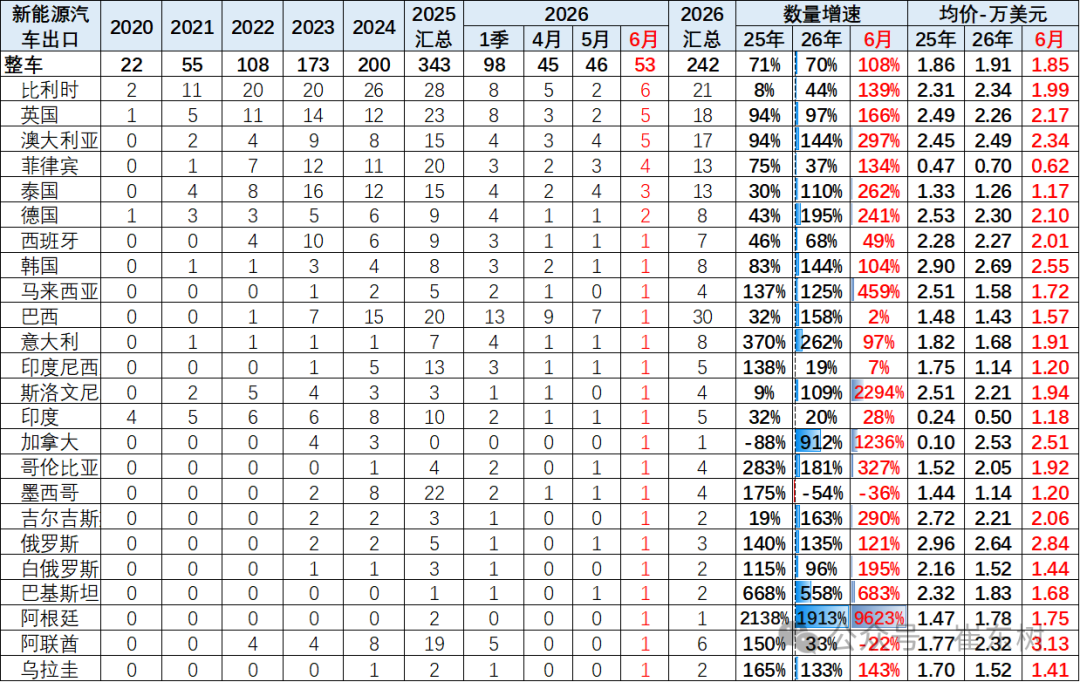
In 2026, the year-on-year growth of NEV exports diverged. NEV exports are mainly the two major markets in Europe and Asia. This year, Brazil surpassed Belgium to become the largest NEV export market, and Brazil's construction drove Brazil's exports to skyrocket. However, Belgium overtook Brazil in June, and Brazil's new energy exports plummeted.
The main markets for NEV exports are generally growing well this year. Markets such as Germany and Italy showed outstanding growth in NEV exports, the Mexican market weakened, and the Thai market picked up.
6. Analysis of changes in NEV exports in 2026
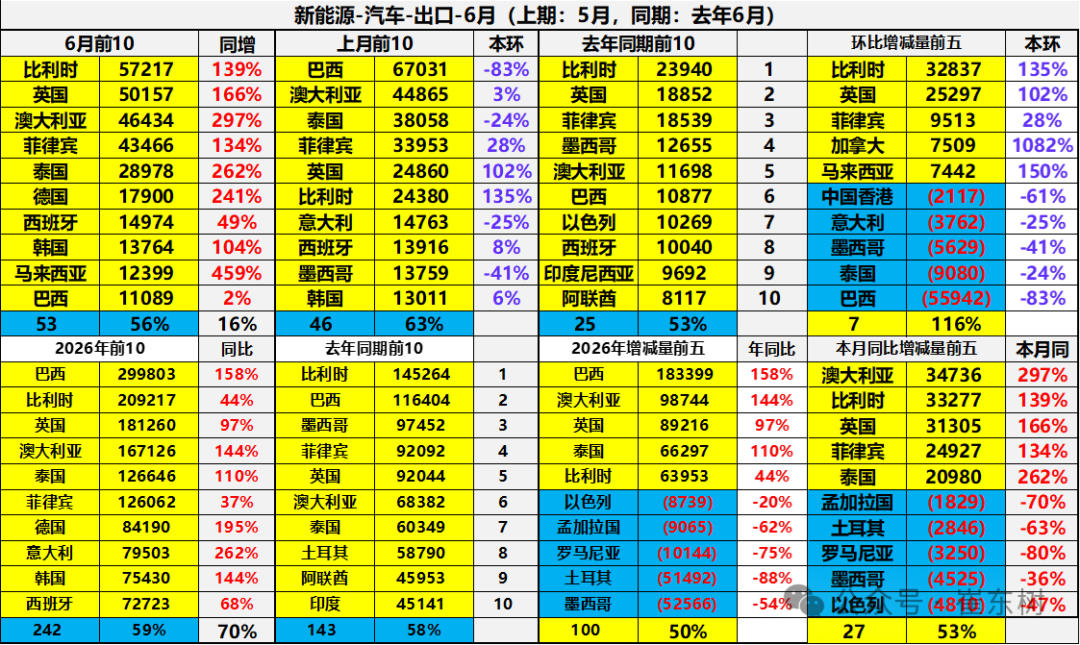
China's top 10 NEV exports in June 2026: Belgium 57,217, UK 50,157, Australia 46,434, Philippines 43,466, Thailand 28,978, Germany 17,900, Spain 14,974, South Korea 13,764, Malaysia 12399, and Brazil 11089. Among them, the top five that increased over the same period were: Australia 34736, Belgium 33,277, the UK 31305, the Philippines 24,927, and Thailand 20,980.
The top 10 countries with total NEV exports from January to June 2026: Brazil 29,9803, Belgium 209,217, UK 181,260, Australia 167126, Thailand 126,646, Philippines 12,6062, Germany 84190, Italy 79,503, South Korea 75430, Spain 72723. Among them, the top five that increased over the same period were: Brazil 183,399, Australia 98,744, UK 89,216, Thailand 66297, Belgium 63,953 vehicles.
Exports to the European Union, such as Brazil, Belgium, and the United Kingdom in 2026, are some of the main directions. Recently, exports to markets such as Turkey and Mexico have been weak.
7. Analysis of changes in fuel vehicle exports by power vehicle
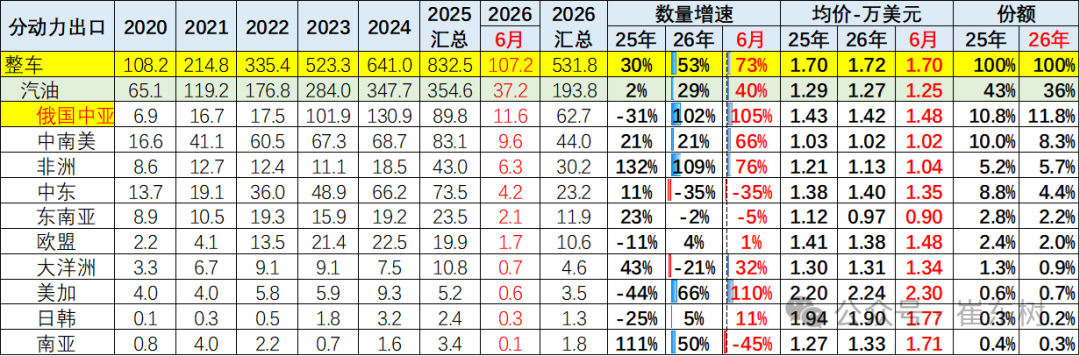
In 2024, China exported 3.48 million gasoline vehicles, an increase of 22%; in 2025, China exported 3.55 million units, an increase of 2%; from January to June 2026, China exported 1.94 million units, an increase of 40%.
This year, China has a strong fuel vehicle market for markets such as Russia, Africa, and South Asia. The overall performance of other markets is average. In particular, fuel vehicle exports to the European Union, Oceania and other markets have declined, and the characteristics of high-quality development are obvious.
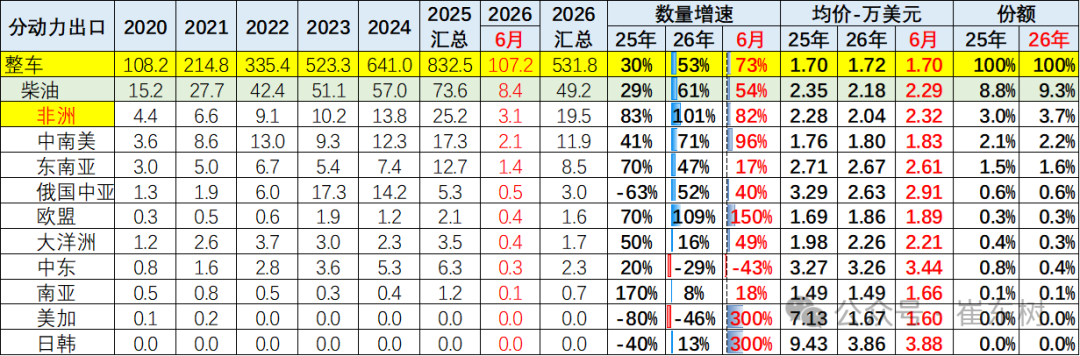
Diesel vehicle exports are better than gasoline vehicles this year, achieving strong growth in diesel vehicles in Africa and Central and South America. Export performance in the Middle East was poor in June.
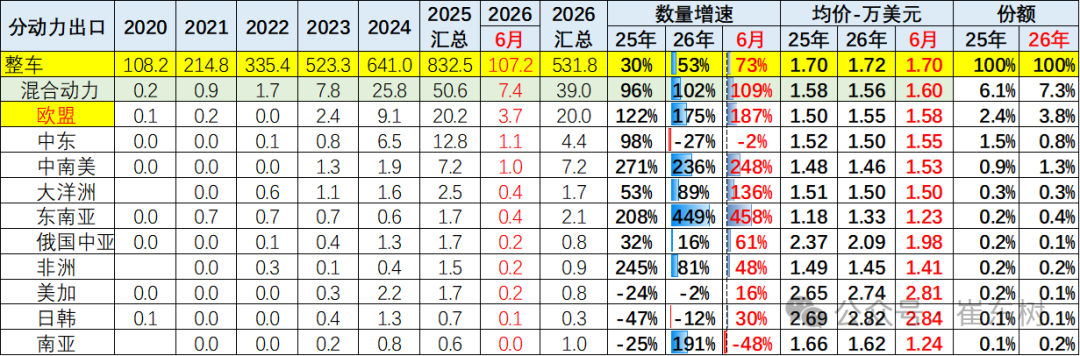
This year, the increase in hybrid models to other markets in Europe, Central and South America, and Asia was strong, reflecting the overall increase in the competitiveness of Chinese passenger cars. However, sales in the Middle East declined sharply, and hybrid performance in Russia's Central Asia region was average.
8. Analysis of changes in NEV exports in 2026
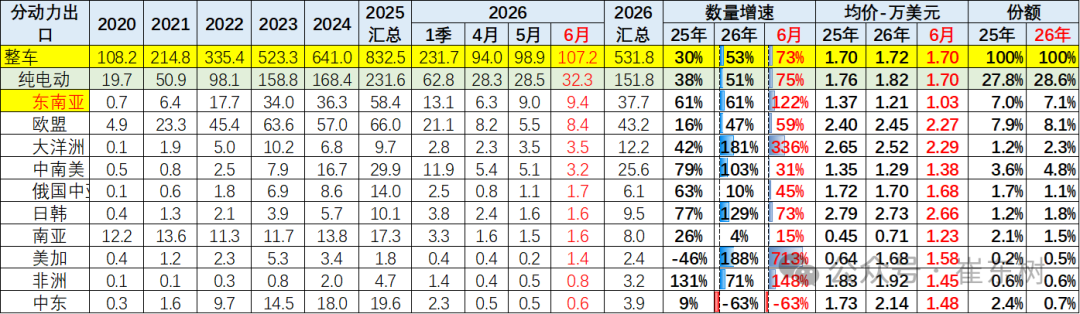
In 2024, China exported 1.68 million pure electric vehicles, an increase of 6%; in 2025, China exported 2.32 million pure electric vehicles, an increase of 38%; from January to June 2026, China exported 1.52 million units of pure electric vehicles, an increase of 51%, and the increase of 75% in June was also very good.
Currently, the EU market for pure electric power is still the absolute main market. Demand in the Southeast Asian market and markets such as Central and South America fluctuates relatively greatly. The Japanese and South Korean markets have clearly risen, but the Middle East market has lost huge losses. Due to the lack of infrastructure abroad, and the fact that China pursues high-end electric power too much, and the characteristics of large-scale expansion are obvious, small electric vehicles lack good products, and there is still room for improvement in pure electric exports.
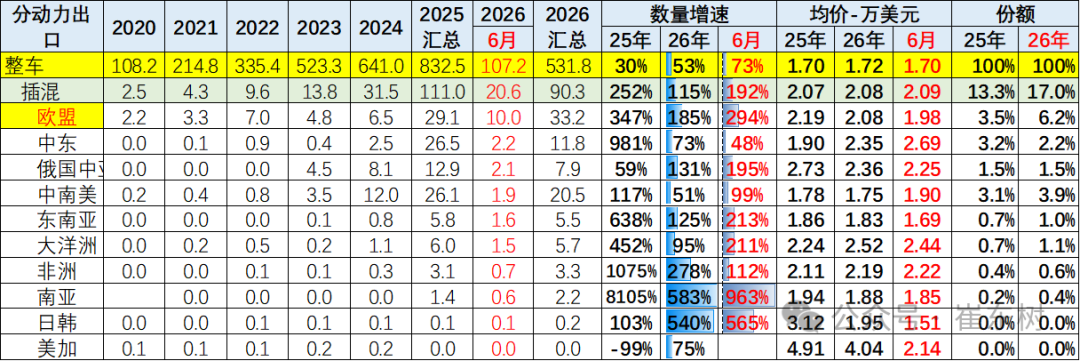
From January to June 2026, China exported 900,000 hybrid vehicles, an increase of 115%, of which 210,000 units were exported in June, an increase of 192%. Apart from regions such as the US and Canada, where there is very little demand for mixing, China's mixed performance in other regions is outstanding. Meanwhile, demand for hybrid models from China has exploded in the European Union, and mixed exports from Turkey and the Middle East are generally increasing.
IV. Export trends by passenger car category
1. Export of passenger cars by emission
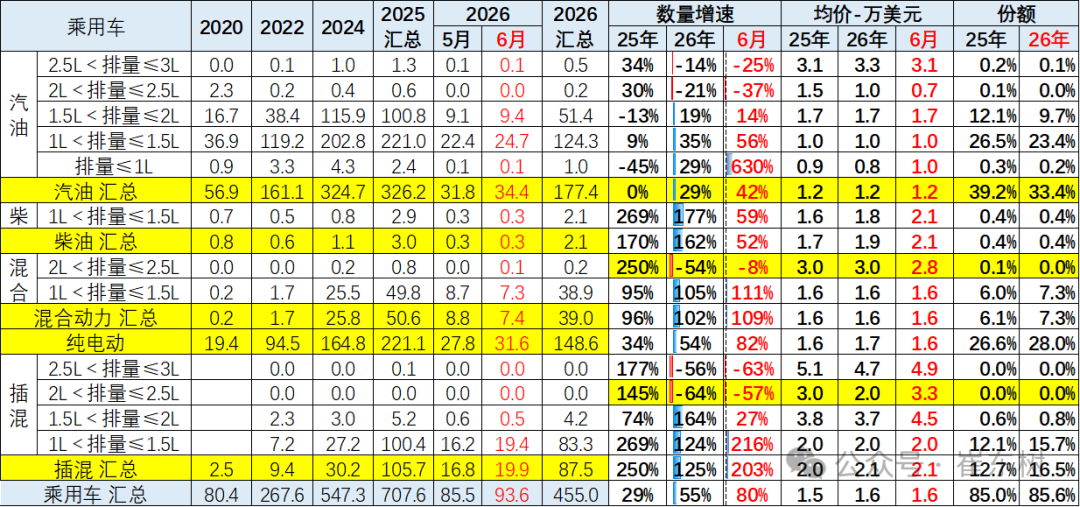
Passenger car exports mainly rely on plug-in hybrid and hybrid passenger cars. Pure electric performance is also strong, and fuel vehicle exports have maintained a good trend. The displacement of fuel vehicles is mainly in the 1 liter to 1.5 liter range. This is also a comprehensive advantage of China's autonomous passenger car products. The 1.5-2 liter model in 2025 declined sharply. Exports of 1.5-2 liter models recovered relatively quickly this year, indicating that Russia and others are more in demand for high-end, high-priced SUV models from China, and there is basically no market for diesel passenger cars.
However, with the product grade differentiation of electric vehicle models, exports of high-end electric vehicles have improved greatly, while entry-level plug-in hybrid exports have grown relatively well.
2. Structural characteristics of passenger vehicle exports
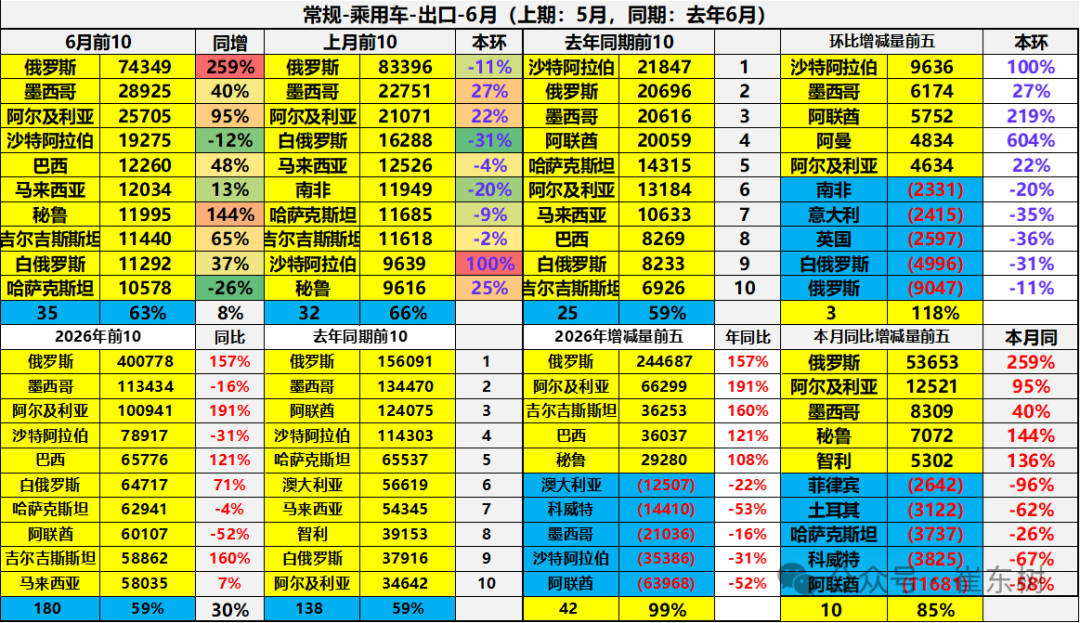
China's largest fuel passenger vehicle exports in June 2026 were Russia's 74349, Mexico's 28,925, Algeria 25,705, Saudi Arabia's 19275, Brazil 12,260, Malaysia 12034, Peru 11995, Kyrgyzstan 11,440, Belarus, and 10,578 Kazakhstan. Among them, the top five that increased over the same period were: Russia 5,3653, Algeria, 12,521 vehicles, Mexico 8,309 vehicles, Peru 7072, Chile 5302 cars.
China's largest fuel passenger car exports from January to June 2026 were Russia 400,778, Mexico 11,3434, Algeria 100,941, Saudi Arabia 78,917, Brazil 65,776, Belarus 64717, Kazakhstan 62941, UAE 60107, Kyrgyzstan 58,862, and Malaysia 58035. Among them, the top five with the biggest increase this year over the same period last year were: Russia 244687, Algeria 66299, and Kyrgyzstan 36253 Vehicles: 36037 from Brazil, 29,280 from Peru.
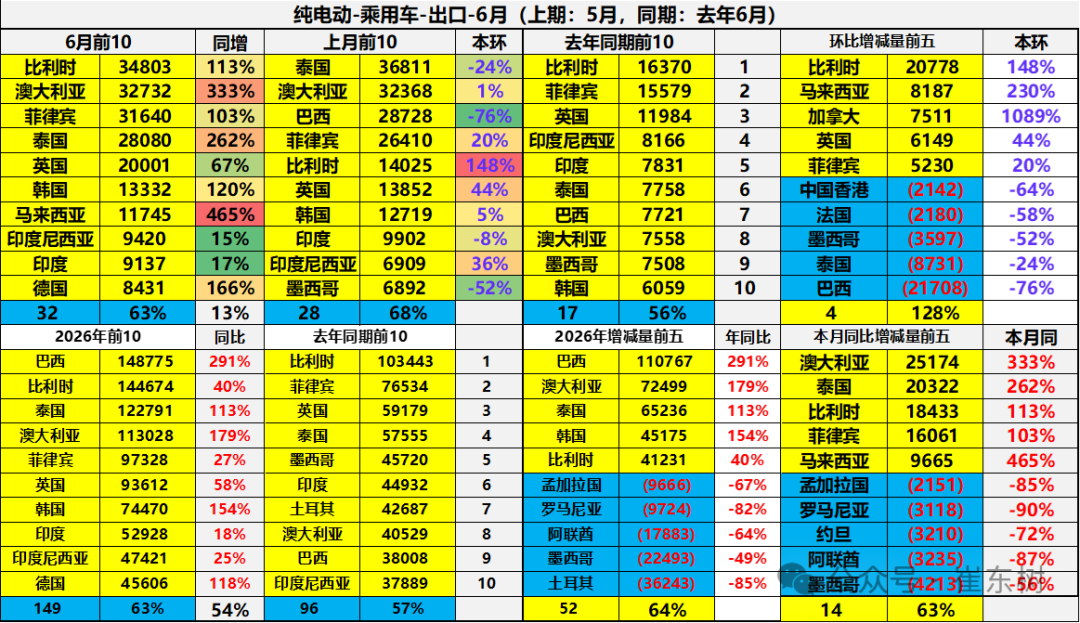
China's exports of pure electric passenger vehicles in June 2026 were mainly 34,803 to Belgium, 3,2732 to Australia, 31640 to the Philippines, 2,8080 to Thailand, 20001 to the UK, 13,332 to South Korea, 11,745 from Malaysia, 9420 from Indonesia, 9137 to India, and 8431 from Germany. Among them, the top five that increased over the same period were: Australia 25,174, Thailand 20,322, Belgium 18,433, the Philippines 1,6061, and Malaysia 9665.
From January to June 2026, China's exports of pure electric passenger vehicles were mainly Brazil 14,8775, Belgium 14,4674, Thailand 12,2791, Australia 11,3028, the Philippines, 93,628, the United Kingdom, 74,470, India, 52928, Indonesia, 47,421, and Germany 45,606. Among them, the top five that increased this year over the same period last year were: Brazil 110,767, Australia 7,2499, Thailand 65,236, South Korea 45,175, and Belgium 41231.
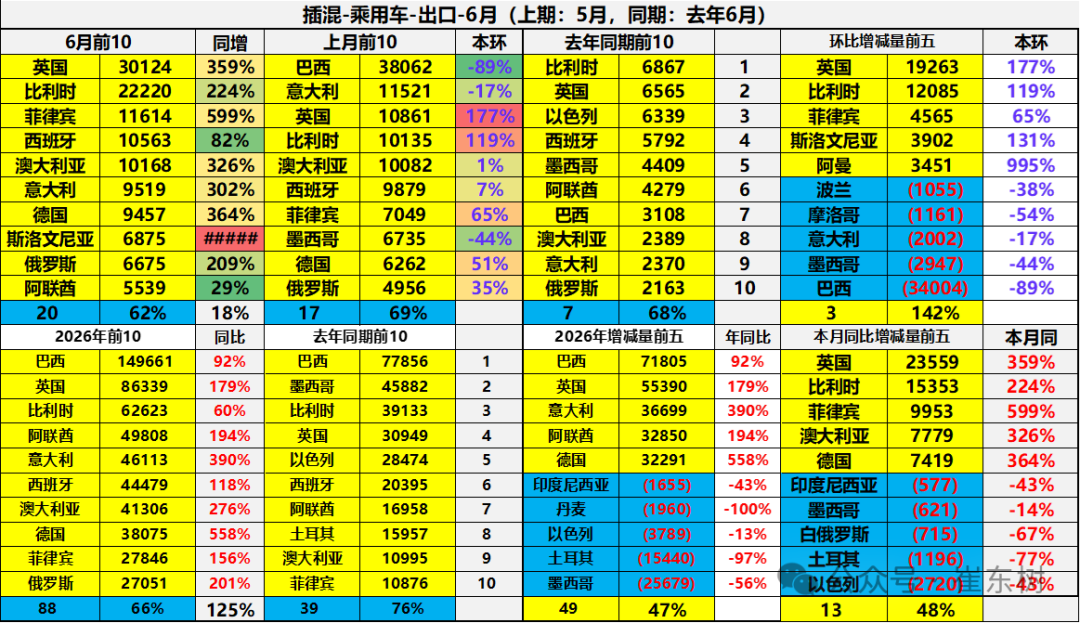
In June 2026, the exports of plug-in hybrid passenger cars were mainly 30,124 British vehicles, 22,220 Belgian vehicles, 11,614 Philippine vehicles, 10563 Spanish vehicles, 10,168 Australian vehicles, 9519 Italian vehicles, 9457 vehicles, Slovenia 6875, Russia 6675, and the United Arab Emirates 5539 vehicles. Among them, the top five that increased over the same period were: the United Kingdom 23,559, Belgium 15,353, the Philippines 9953, Australia 7779, and Germany 7419.
From January to June 2026, the exports of hybrid passenger cars were mainly Brazil's 149661, the United Kingdom 86,339, Belgium 62,623, the UAE 49,808, Italy 46113, Spain 44,479, Australia 4,130, Germany, 38075, the Philippines, 27,846, and Russia 27051. Among them, the top five that increased this year over the same period last year were: Brazil 71805, the United Kingdom 55,390, Italy 36,699, the United Arab Emirates 32850, and Germany 32,291.

In June 2026, the export of passenger car ordinary hybrids was mainly 8399 in Italy, 7649 in the UK, 4715 in Poland, 4058 in Australia, 4038 in Argentina, 3,843 in Spain, 3516 in Iraq, 2508 in France, 2165 in Jordan, and 2128 in the UAE. Among them, the top five that increased over the same period were: Italy 7699, Poland 4065, Argentina 4037, the United Kingdom, and 3,182 Iraq.
From January to June 2026, passenger car ordinary hybrids were mainly 39,558 in the UK, 37,772 in Italy, 35,691 in Brazil, 3,4036 in Spain, 25,190 in France, 21,461 in Poland, 16,428 in the UAE, 13,548 in Australia, 13,422 in Argentina, and 9591 in Pakistan. Among them, the top five that increased this year over the same period last year were: Brazil 2,6062, Italy 23,902, Spain 19667, Poland 19,504, and the United Kingdom 19404.
5. Export trends by truck category
1. Truck exports
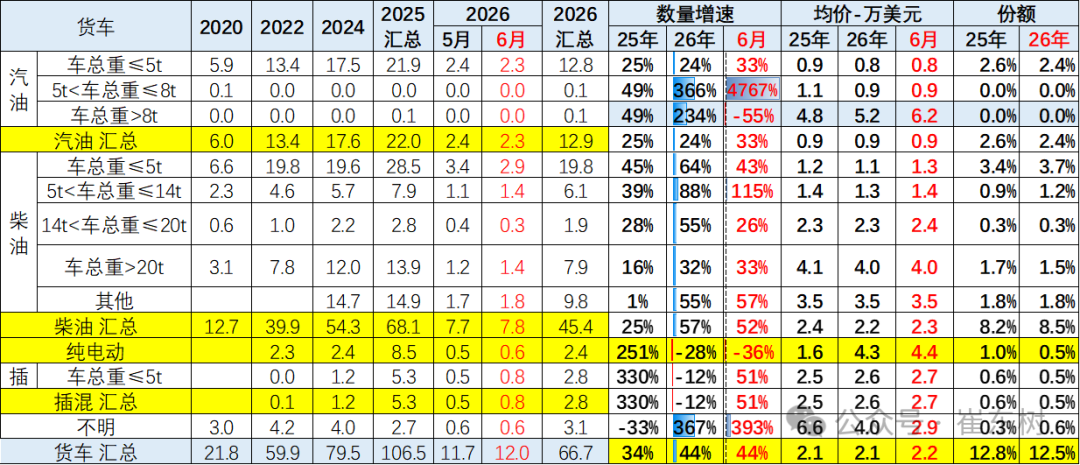
Export growth in the truck market has not been strong in recent years. The share of the automobile export market has continued to shrink slightly, but in 2026, the strong performance of diesel light trucks led to an improvement in export share. The main force in the truck market is gasoline and diesel trucks under 5 tons. Overall, there is also strong demand for heavy diesel trucks of 5-14 tons and 20 tons or more.
2. Characteristics of changes in the truck export market
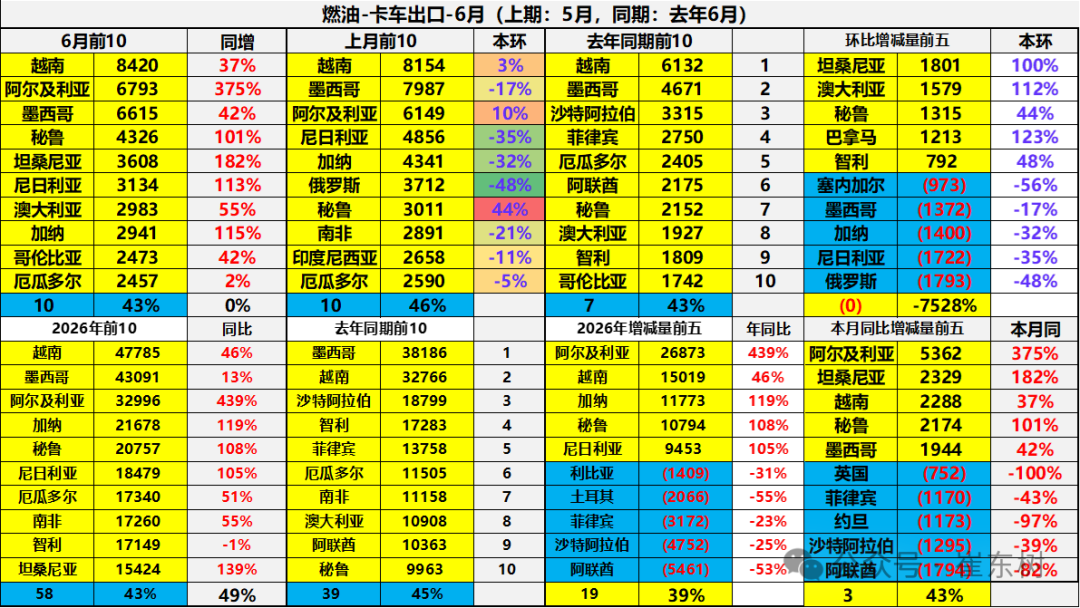
The overall performance of the top few fuel truck export markets was stable. The main export markets for fuel trucks from January to June 2026: Vietnam 47,785, Mexico 43091, Algeria, 32996, Ghana 21,678, Peru 20,757, Nigeria 18,479, Ecuador 17,340, South Africa, 17,260, Chile, and 15,424 Tanzania. Among them, the top five that increased this year over the same period last year were: Algeria 26,873, Vietnam 1,5019, Ghana 11,773, Peru 10,794, and Nigeria 9453.
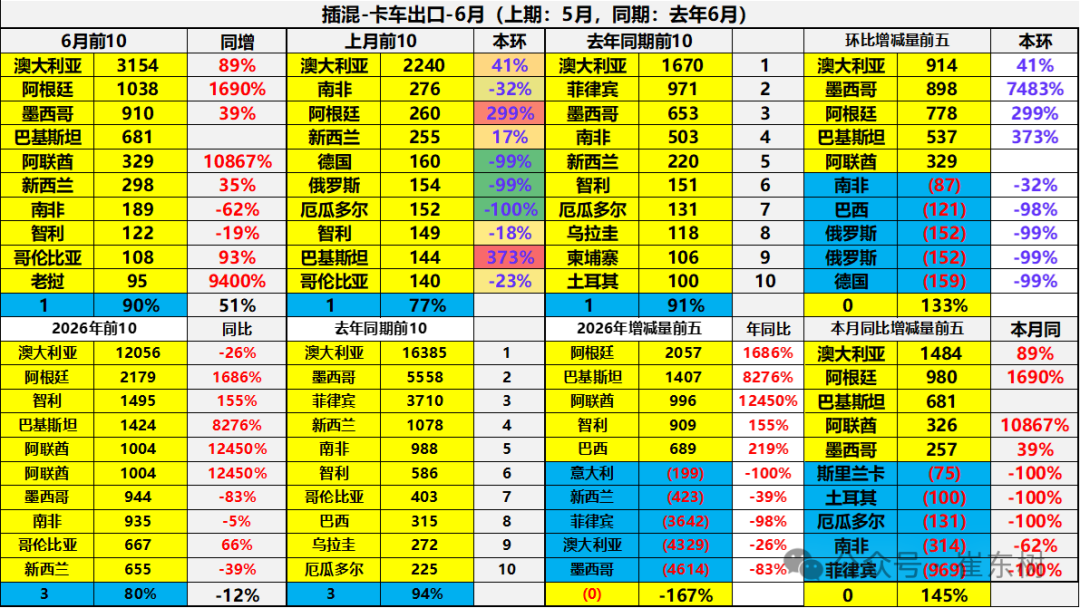
The mixed truck export market has recently been strong. This is mainly due to the increase in the passenger car attributes of pickup trucks, which have created convenient and cost-effective use in overseas markets.
The current export market in June was Australia with 3,154 vehicles, Argentina 1,038, Mexico 910, Pakistan 681, UAE 329, New Zealand 298, South Africa 189, Chile 122, Colombia 108, and Laos 95. Among them, the top five vehicles that increased over the same period were: Australia 1,484, Argentina 980, Pakistan 681, UAE 326, and Mexico 257.
Currently, the total number of vehicles exported throughout the year is 1,2056 to Australia, 2,179 to Argentina, 1,495 from Chile, 1,531 from the UAE, 1004 from the UAE, 944 from Mexico, 935 from South Africa, 667 from Colombia, and 655 from New Zealand. Among them, the top five that increased this year over the same period last year are: Argentina 2,057, Pakistan 1,407, UAE 996, Chile, and 689 Brazil.
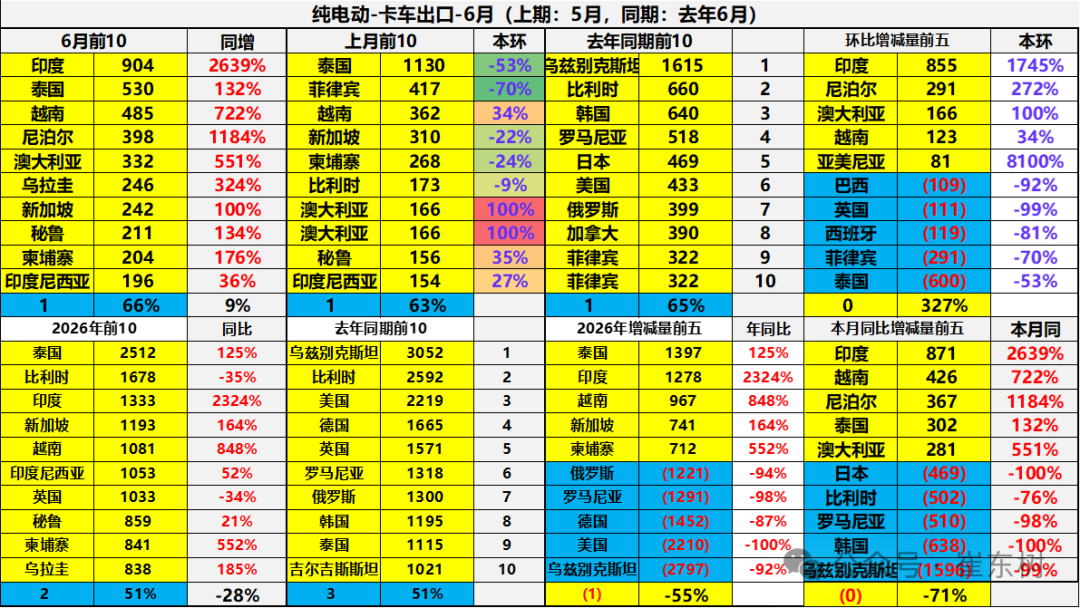
The export market for pure electric trucks has recently surged. This is mainly due to a sharp increase in the attributes of special vehicles, creating a strong scenario convenience and cost advantage in overseas markets.
6. Export trends by passenger car category
1. Overall bus exports
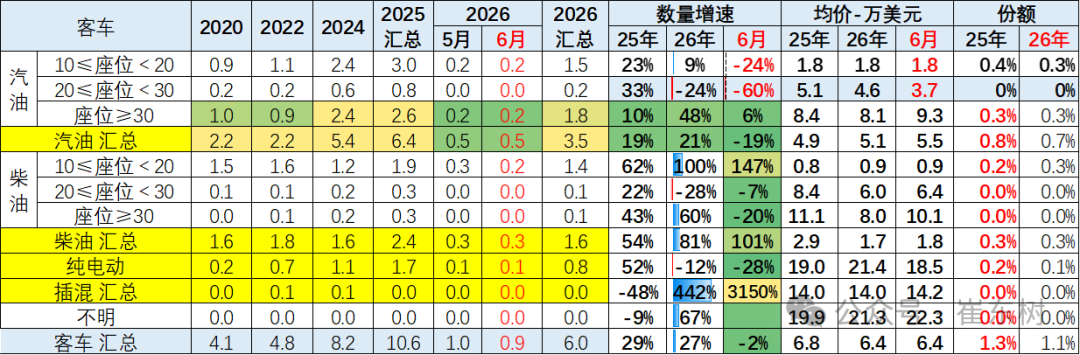
Recently, world demand for buses has declined to a certain extent, causing China's bus exports to continue to shrink in the previous two years, from 64,000 vehicles in 2019 to 48,000 units in 2022. World demand has recovered since 2023, and the total number of buses in China reached 106,000 in 2025.
From January to June 2026, the export performance of pure electric buses was 80,000, with an average decrease of 12%. Exports of diesel buses from a low base increased significantly, and exports of large and medium-sized gasoline buses were average.
2. Characteristics of changes in the bus export market
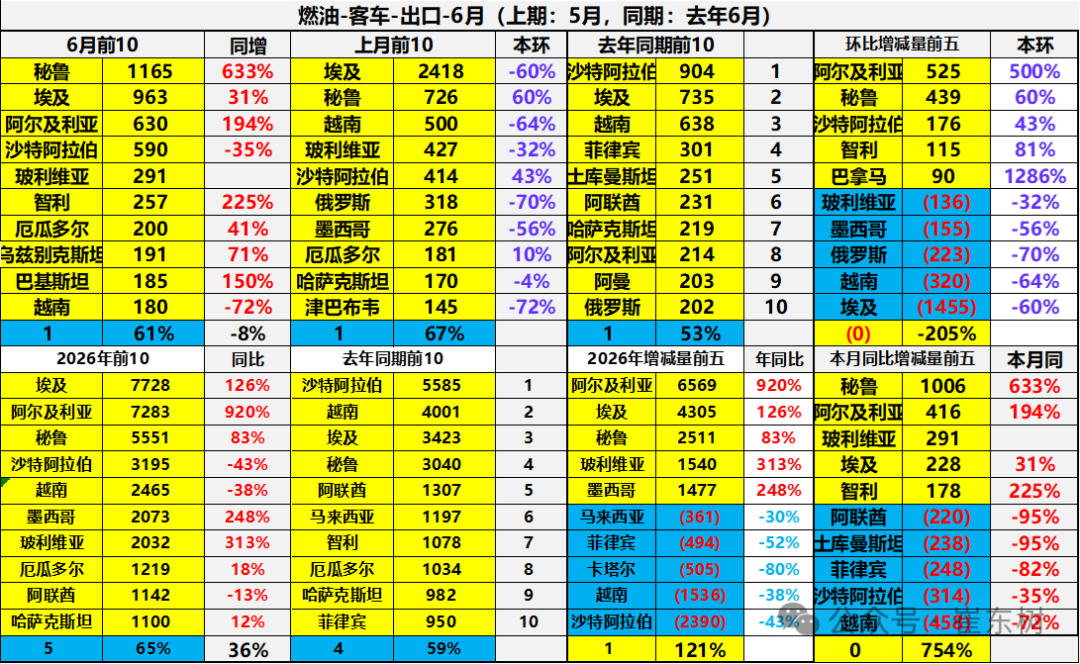
China's main fuel bus export market is scattered, mainly from underdeveloped countries. The market is complex, making it difficult to continue exporting in an orderly manner.
The main fuel bus exports in June this year were 1,165 in Peru, 963 in Egypt, 630 in Algeria, 590 in Saudi Arabia, 291 in Bolivia, 257 in Chile, 200 in Ecuador, 191 in Uzbekistan, 185 in Pakistan, and 180 in Vietnam. Among them, the top five that increased in the current period over the same period were: Peru 1006, Algeria 416, Bolivia 291, Egypt 228, and Chile 178.
The main fuel bus exports this year were: Egypt, 7,728, Algeria, 5551, Peru, 3195 Saudi Arabia, 2,465, Vietnam, 2073, Bolivia, 2,032, Ecuador, 1219, the United Arab Emirates, and 1,100 Kazakhstan. Among them, the top five that increased this year over the same period last year were: Algeria 6569, Egypt 4305, Peru 2511, Bolivia 1,540, and Mexico 1,477.
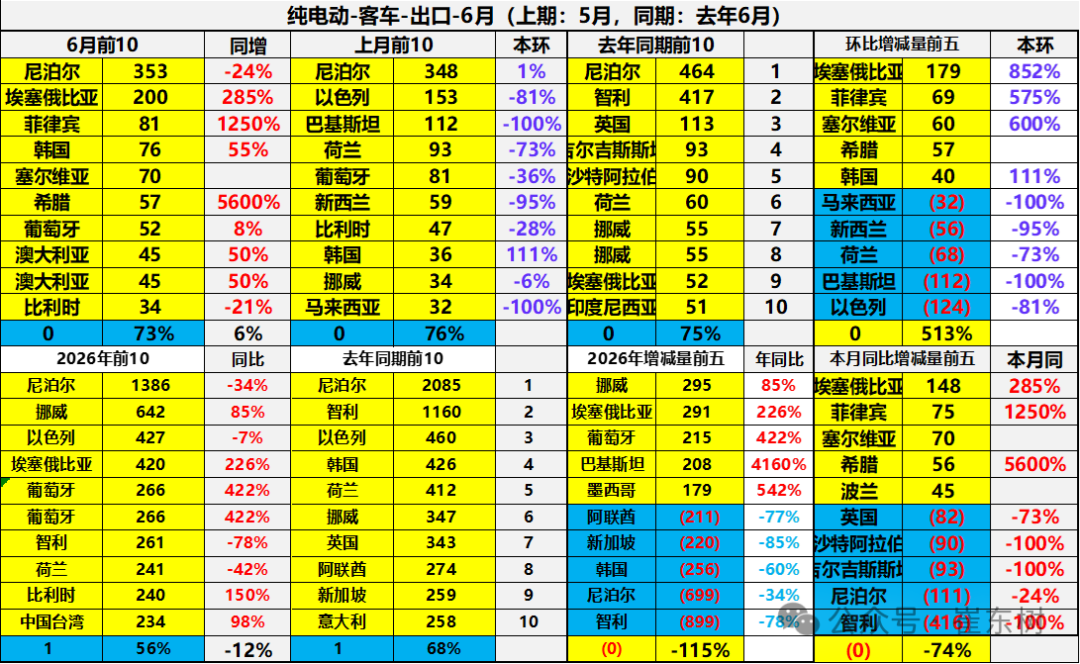
The export market for pure electric buses is small, and the data fluctuates greatly. The main export forces in June this year were: Nepal 353, Ethiopia 200, Philippines 81, South Korea 76, Serbia 70, Greece 57, Portugal 52, Australia 45, Australia 45, and Belgium 34. Among them, the top five that increased over the same period were: 148 in Ethiopia, 75 in the Philippines, 70 in Serbia, 56 in Greece, and 45 in Poland.
The main exporters of pure electric buses this year were 1,386 in Nepal, 642 in Norway, 427 in Israel, 420 in Ethiopia, 266 in Portugal, 266 in Portugal, 266 in Chile, 241 in the Netherlands, 240 in Belgium, and 234 in Taiwan. Among them, the top five that increased this year over the same period last year were: 295 in Norway, 291 in Ethiopia, 215 in Portugal, 208 in Pakistan, and 179 in Mexico.