
- PRICING
- LIVE QUOTES
- LEARN
- HELP


EN
Manchester United (MANU) Could Be 43% Undervalued On Manu Kone Transfer Talks
Manchester United (MANU) stock is in focus after reports that the club has reached personal terms with midfielder Manu Kone, with the potential transfer drawing fresh attention to the company’s broader midfield rebuild.
See our latest analysis for Manchester United.
For investors tracking Manchester United, the Kone talks land at a time when momentum in the stock has picked up, with a 30.8% 90 day share price return and a 41.6% five year total shareholder return suggesting interest has been building over time.
If this transfer story has you thinking about where else capital might work hard in the market, it could be a good moment to scan 17 top founder-led companies
Bulls point to Manchester United’s midfield rebuild, recent share price momentum and a sizeable modelled intrinsic discount, while bears focus on ongoing losses and execution risk on and off the pitch. The key question is which side the valuation currently supports.
Preferred Price-to-Sales of 4.2x: Is it justified?
Manchester United is currently valued at a P/S ratio of 4.2x, while also trading at a 43.1% discount to the SWS DCF fair value estimate of $39.21 versus a last close of $22.32.
The P/S ratio compares the company’s market value with its annual revenue, giving a sense of how much investors are paying for each dollar of sales. For a business like Manchester United, where profitability is still a work in progress and net income was a loss of $18.13 million on revenue of $684.33 million, P/S is often used as a quick yardstick alongside cash flow based work such as the SWS DCF model.
Here, the tension is clear. On one hand, the SWS DCF model implies a sizeable potential valuation gap, with the stock trading 43.1% below the modelled fair value of $39.21. On the other hand, the preferred multiple suggests investors are already paying a richer price for current sales than both the estimated fair P/S of 2.2x and the wider US Entertainment industry, where the average is 1.2x and peers sit around 2x. That is a strong premium, and it marks out a level to which the market could move if sentiment or growth expectations cool.
Explore the SWS fair ratio for Manchester United
Result: Price-to-Sales of 4.2x (OVERVALUED).
However, ongoing losses and any stalling in Manchester United’s revenue growth, currently reported at 8.4%, could quickly challenge the justification for today’s richer P/S multiple.
Find out about the key risks to this Manchester United narrative.
Another view on Manchester United’s value
While the current P/S ratio of 4.2x suggests Manchester United trades at a premium to its fair ratio of 2.2x, the SWS DCF model points the other way, indicating the stock is trading at a 43.1% discount to an estimated fair value of $39.21. Which signal should matter more to you right now?
Look into how the SWS DCF model arrives at its fair value.
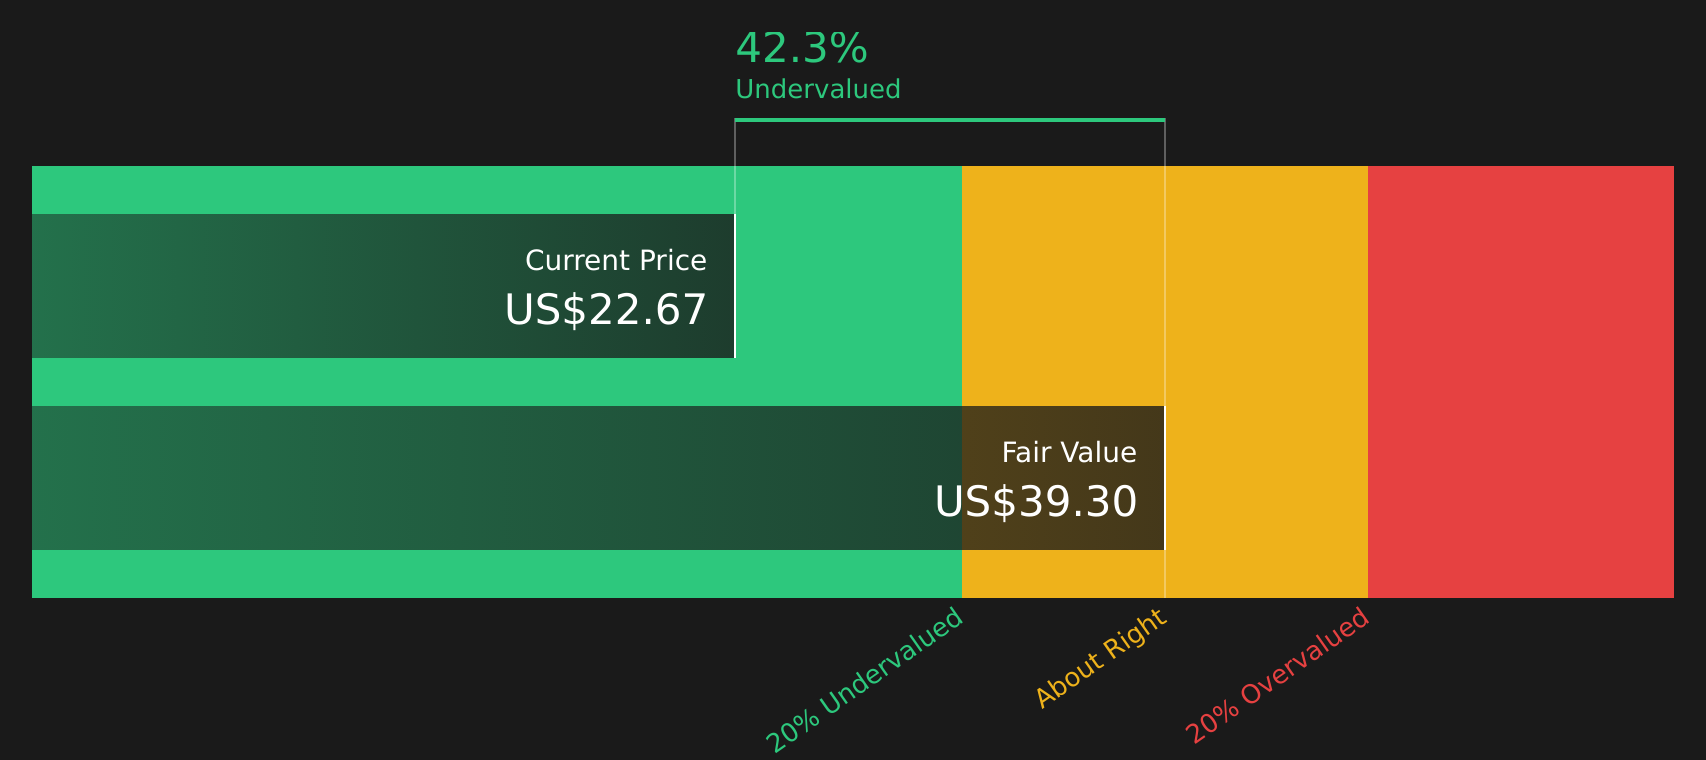
Simply Wall St performs a discounted cash flow (DCF) on every stock in the world every day (check out Manchester United for example). We show the entire calculation in full. You can track the result in your watchlist or portfolio and be alerted when this changes, or use our stock screener to discover 38 high quality undervalued stocks. If you save a screener we even alert you when new companies match - so you never miss a potential opportunity.
Next Steps
With Manchester United presenting both potential upside and clear concerns, it makes sense to move quickly, review the underlying data and decide where you stand. To weigh these mixed signals side by side, take a closer look at the 3 key rewards and 1 important warning sign.
Looking for more investment ideas beyond Manchester United?
If you are weighing Manchester United and want a broader watchlist, it is worth lining up a few more ideas so you are not relying on a single story.
- Scan for quality at a discount with the 38 high quality undervalued stocks that highlights companies combining stronger fundamentals with prices that currently sit below their estimated worth.
- Strengthen your income backbone by reviewing the 7 dividend fortresses and focus on businesses offering higher yields alongside more resilient payout profiles.
- Reduce portfolio stress by filtering candidates through the 79 resilient stocks with low risk scores so you can concentrate on stocks with more robust risk scores and steadier profiles.
This article by Simply Wall St is general in nature. We provide commentary based on historical data and analyst forecasts only using an unbiased methodology and our articles are not intended to be financial advice. It does not constitute a recommendation to buy or sell any stock, and does not take account of your objectives, or your financial situation. We aim to bring you long-term focused analysis driven by fundamental data. Note that our analysis may not factor in the latest price-sensitive company announcements or qualitative material. Simply Wall St has no position in any stocks mentioned.
Have feedback on this article? Concerned about the content? Get in touch with us directly. Alternatively, email editorial-team@simplywallst.com