
- PRICING
- LIVE QUOTES
- LEARN
- HELP


EN
Oppenheimer Holdings (OPY) Looks Cheap On P E, Is Fair Value Much Lower?
Oppenheimer Holdings (OPY) has drawn fresh attention after recent share performance data showed modest pullbacks over the past week and past 3 months, alongside strong year to date and 1 year total returns.
See our latest analysis for Oppenheimer Holdings.
At the current share price of $110.54, Oppenheimer Holdings has experienced short term share price pressure over the past week. Its year to date share price return of 52.18% and 1-year total shareholder return of 54.86% sit alongside 3- and 5-year total shareholder returns of around 182%, which may indicate earlier optimism about growth prospects or improved perceptions of risk.
If you are thinking beyond Oppenheimer Holdings and want to see which other companies investors are watching, this is a good moment to check out 18 top founder-led companies
The sharp pullback over the past week sits awkwardly against Oppenheimer Holdings' strong multi year returns and the valuation estimates implied by recent data. Where might a fair value range actually sit as the numbers are unpacked next?
Price-to-Earnings of 12.2x: Is it justified?
On a simple P/E comparison, Oppenheimer Holdings looks inexpensive next to the broader US market and its own capital markets peers at the current $110.54 share price.
The P/E ratio measures how much investors are paying today for each dollar of current earnings. For a company like Oppenheimer Holdings, which earns income from capital markets activity and wealth management, this metric is a common shorthand for how the market is weighing its earnings profile against alternatives.
Here, the picture is mixed. On one hand, earnings have declined by an average of 13.6% per year over the past 5 years, which can help explain why investors are not paying a richer multiple. On the other hand, earnings growth over the past year of 27.6%, improved net profit margins from 5.6% to 6%, and an experienced board and management team show that recent performance and governance factors are not entirely aligned with the longer term earnings decline.
The real contrast comes when you put Oppenheimer Holdings side by side with its sector. The stock trades on a 12.2x P/E, compared with 19.2x for the US market and 40.3x for the US Capital Markets industry, as well as 20.1x for its immediate peer group. That is a substantial discount, which indicates the market is assigning a meaningfully lower valuation to its earnings than both the wider market and sector are getting, despite recent earnings and margin trends improving.
See what the numbers say about this price — find out in our valuation breakdown.
Result: Price-to-Earnings of 12.2x (UNDERVALUED)
However, investors in Oppenheimer Holdings still face the risk that earnings pressure resumes or that capital markets activity softens, which could challenge today's P/E discount narrative.
Find out about the key risks to this Oppenheimer Holdings narrative.
Another View on Oppenheimer Holdings: Our DCF Model Points Higher Risk
While the 12.2x P/E suggests Oppenheimer Holdings looks inexpensive, our DCF model tells a different story. At a share price of $110.54, it sits above the SWS estimate of future cash flow value of $59.08, which points to an overvalued signal and a potential valuation risk for new buyers.
Investors looking to understand why the cash flow view diverges so sharply from the earnings multiple may want to see how the assumptions differ and what would need to change for those numbers to come closer together, which is where Look into how the SWS DCF model arrives at its fair value.
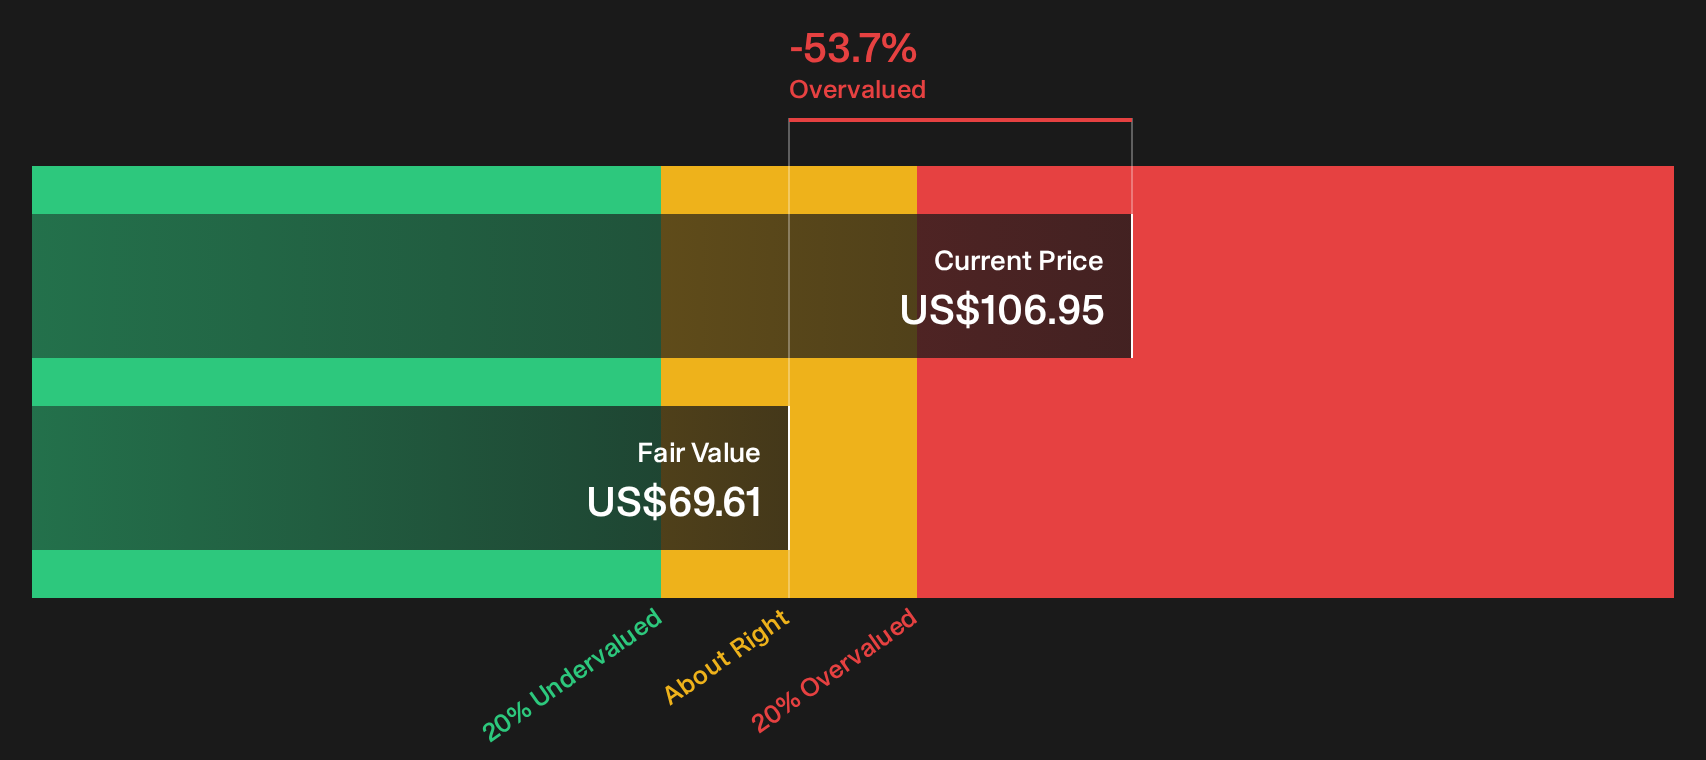
Simply Wall St performs a discounted cash flow (DCF) on every stock in the world every day (check out Oppenheimer Holdings for example). We show the entire calculation in full. You can track the result in your watchlist or portfolio and be alerted when this changes, or use our stock screener to discover 47 high quality undervalued stocks. If you save a screener we even alert you when new companies match - so you never miss a potential opportunity.
Next Steps
Seen enough mixed signals on Oppenheimer Holdings to feel uncertain about the story so far? This is a good time to review the numbers yourself, weigh both the potential upside and the highlighted risks, and then decide how it all fits with your own approach, including the 1 key reward and 1 important warning sign
Looking for more investment ideas beyond Oppenheimer Holdings?
If Oppenheimer Holdings has sharpened your focus on valuation and quality, do not stop here. Use the Simply Wall St screener to help identify other opportunities before they move.
- Explore potential upside by reviewing companies that look attractively priced on key metrics through the 47 high quality undervalued stocks.
- Support your income stream by assessing stocks that offer higher yields and resilient payouts with the 7 dividend fortresses.
- Emphasize capital preservation by filtering for companies that show lower risk characteristics using the 82 resilient stocks with low risk scores.
This article by Simply Wall St is general in nature. We provide commentary based on historical data and analyst forecasts only using an unbiased methodology and our articles are not intended to be financial advice. It does not constitute a recommendation to buy or sell any stock, and does not take account of your objectives, or your financial situation. We aim to bring you long-term focused analysis driven by fundamental data. Note that our analysis may not factor in the latest price-sensitive company announcements or qualitative material. Simply Wall St has no position in any stocks mentioned.
Have feedback on this article? Concerned about the content? Get in touch with us directly. Alternatively, email editorial-team@simplywallst.com