
- PRICING
- LIVE QUOTES
- LEARN
- HELP


EN
European Market: 3 Stocks That May Be Trading Below Their Estimated Value
As the European market navigates a landscape marked by mixed economic indicators and geopolitical tensions, investors are keenly watching for opportunities amid the region's fluctuating indices. In this environment, identifying stocks that may be trading below their estimated value can offer potential advantages, particularly when these companies demonstrate strong fundamentals and resilience in challenging conditions.
Top 10 Undervalued Stocks Based On Cash Flows In Europe
| Name | Current Price | Fair Value (Est) | Discount (Est) |
| Vossloh (XTRA:VOS) | €59.20 | €116.49 | 49.2% |
| New Wave Group (OM:NEWA B) | SEK91.50 | SEK179.52 | 49% |
| Hemnet Group (OM:HEM) | SEK86.00 | SEK171.38 | 49.8% |
| ERAMET (ENXTPA:ERA) | €42.84 | €83.52 | 48.7% |
| Dynavox Group (OM:DYVOX) | SEK76.40 | SEK148.40 | 48.5% |
| Com.Tel (BIT:CMTL) | €1.87 | €3.70 | 49.4% |
| Casta Diva Group (BIT:CDG) | €3.05 | €6.04 | 49.5% |
| Cambi (OB:CAMBI) | NOK21.70 | NOK42.86 | 49.4% |
| Altri SGPS (ENXTLS:ALTR) | €4.68 | €9.16 | 48.9% |
| Allgeier (XTRA:AEIN) | €16.30 | €32.04 | 49.1% |
We'll examine a selection from our screener results.
Laboratorios Farmaceuticos Rovi (BME:ROVI)
Overview: Laboratorios Farmaceuticos Rovi, S.A. is engaged in the manufacturing, selling, and marketing of pharmaceutical products across Spain, the European Union, OECD countries, and internationally with a market cap of €2.87 billion.
Operations: Laboratorios Farmaceuticos Rovi's revenue is primarily derived from its pharmaceutical products distributed across Spain, the European Union, OECD countries, and international markets.
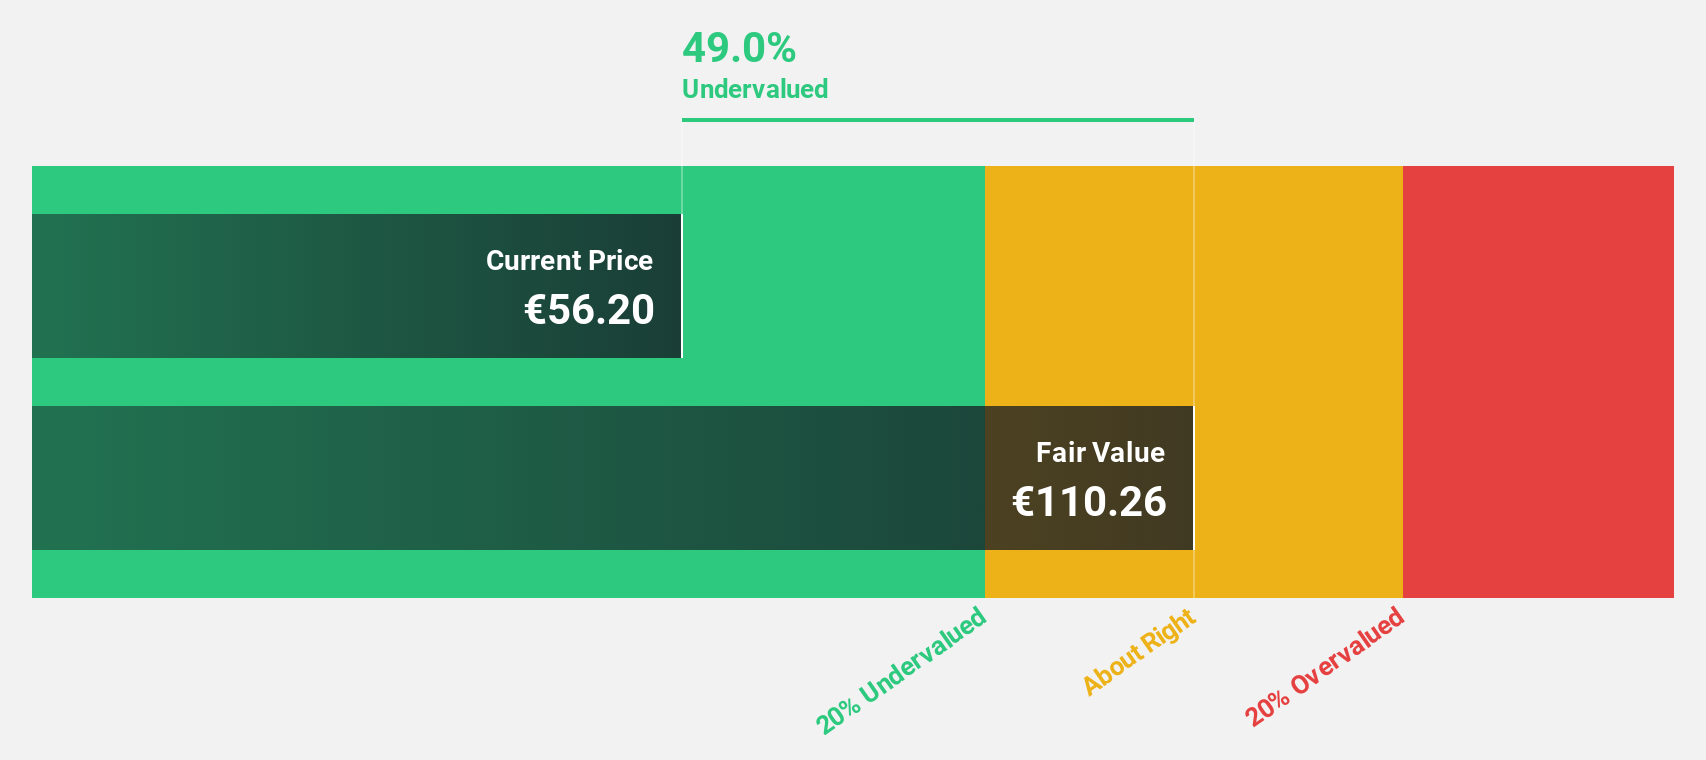
Estimated Discount To Fair Value: 48.5%
Laboratorios Farmaceuticos Rovi is trading significantly below its estimated future cash flow value, with a current price of €56.2 compared to an estimated €109.13. Despite recent earnings guidance revisions indicating moderate revenue growth, analysts anticipate a 31.4% stock price increase. The company's earnings are projected to grow faster than the Spanish market at 16.6% per year, supported by robust forecasted revenue growth of 9.2% annually and high expected return on equity at 23%.
- Our earnings growth report unveils the potential for significant increases in Laboratorios Farmaceuticos Rovi's future results.
- Navigate through the intricacies of Laboratorios Farmaceuticos Rovi with our comprehensive financial health report here.
YIT Oyj (HLSE:YIT)
Overview: YIT Oyj is a construction services company operating in Finland, Estonia, Lithuania, Latvia, Czechia, Slovakia, and Poland with a market cap of €622.74 million.
Operations: YIT Oyj's revenue is derived from four primary segments: Infrastructure (€521 million), Residential CEE (€312 million), Residential Finland (€303 million), and Building Construction (€664 million).
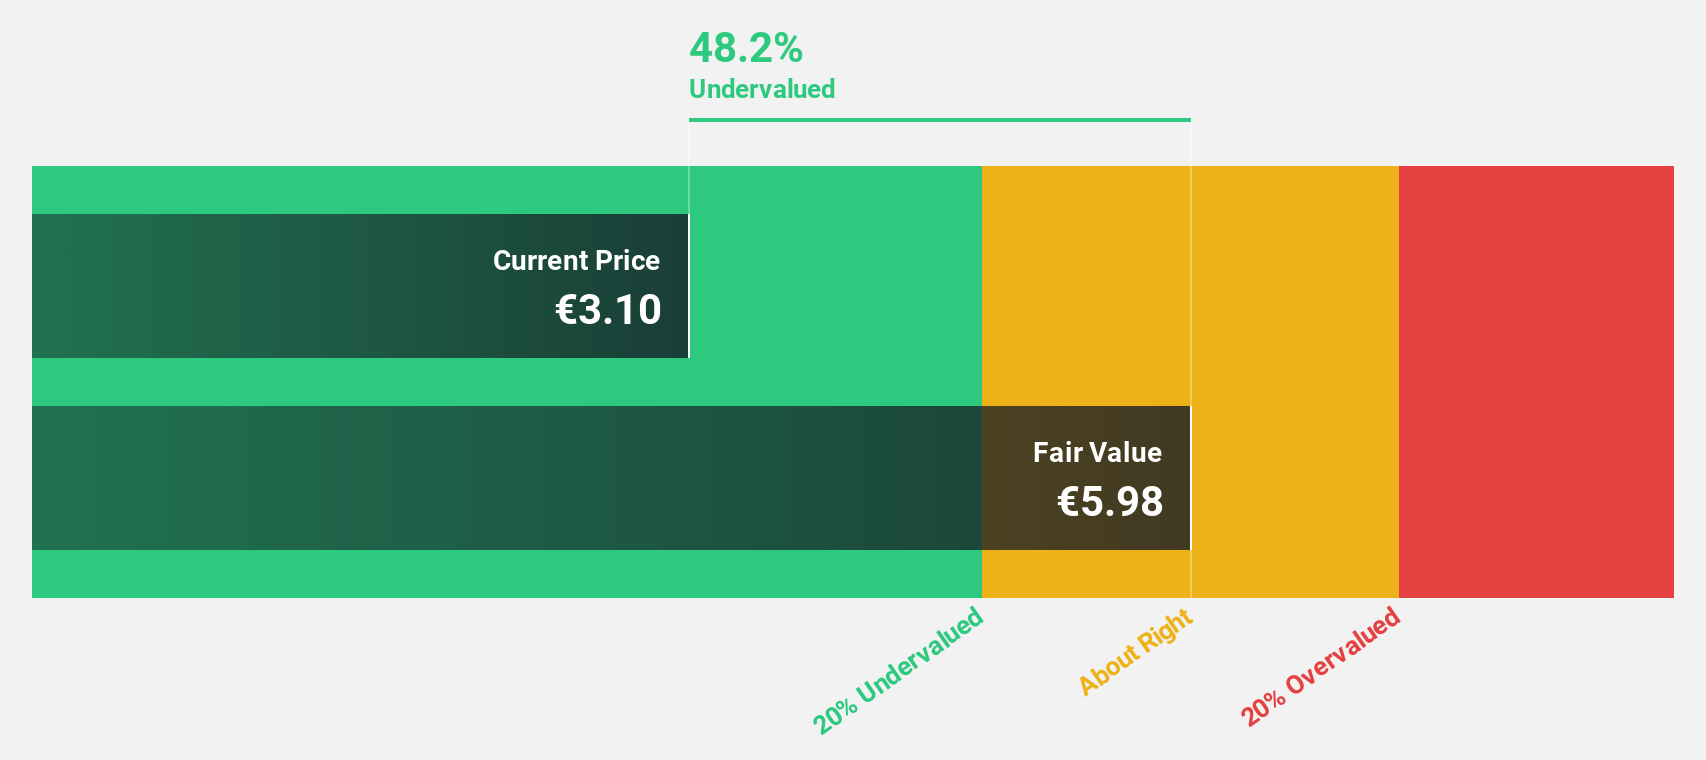
Estimated Discount To Fair Value: 14.8%
YIT Oyj is trading at €2.7, below its estimated future cash flow value of €3.17, indicating potential undervaluation based on cash flows. While the company is expected to achieve profitability within three years with strong earnings growth of 81.26% annually, its interest payments are not well covered by earnings. Recent projects include a €300 million data center in Finland and several construction contracts, bolstering its order book for upcoming quarters.
- In light of our recent growth report, it seems possible that YIT Oyj's financial performance will exceed current levels.
- Take a closer look at YIT Oyj's balance sheet health here in our report.
Kitron (OB:KIT)
Overview: Kitron ASA is an electronics manufacturing services provider operating in multiple countries, including Norway, Sweden, and the United States, with a market cap of NOK19.18 billion.
Operations: The company generates revenue of €969.90 million from its Electronics Manufacturing Services (EMS) segment.
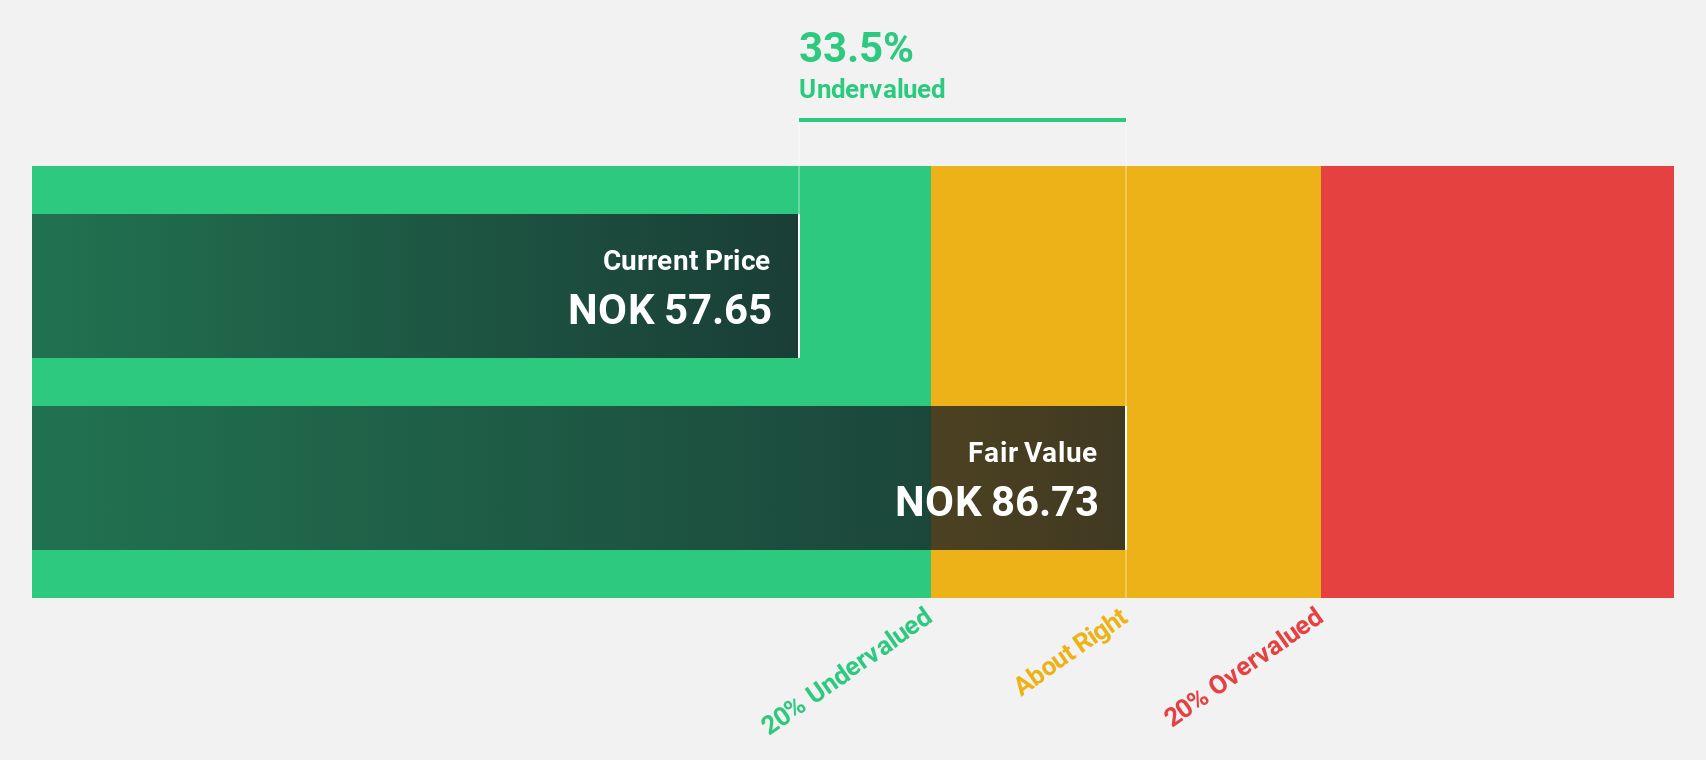
Estimated Discount To Fair Value: 17.1%
Kitron, trading at NOK87.7, is below its estimated future cash flow value of NOK105.75, suggesting undervaluation based on cash flows. The company reported strong earnings growth with Q2 sales reaching €295.7 million and net income of €21.4 million, both significantly up from the previous year. Kitron's revenue and earnings are forecast to grow faster than the Norwegian market, supported by strategic expansions like a new facility in Sweden for defense programs.
- Our comprehensive growth report raises the possibility that Kitron is poised for substantial financial growth.
- Unlock comprehensive insights into our analysis of Kitron stock in this financial health report.
Make It Happen
- Click this link to deep-dive into the 207 companies within our Undervalued European Stocks Based On Cash Flows screener.
- Have a stake in these businesses? Integrate your holdings into Simply Wall St's portfolio for notifications and detailed stock reports.
- Simply Wall St is a revolutionary app designed for long-term stock investors, it's free and covers every market in the world.
Curious About Other Options?
- Explore high-performing small cap companies that haven't yet garnered significant analyst attention.
- Diversify your portfolio with solid dividend payers offering reliable income streams to weather potential market turbulence.
- Fuel your portfolio with companies showing strong growth potential, backed by optimistic outlooks both from analysts and management.
This article by Simply Wall St is general in nature. We provide commentary based on historical data and analyst forecasts only using an unbiased methodology and our articles are not intended to be financial advice. It does not constitute a recommendation to buy or sell any stock, and does not take account of your objectives, or your financial situation. We aim to bring you long-term focused analysis driven by fundamental data. Note that our analysis may not factor in the latest price-sensitive company announcements or qualitative material. Simply Wall St has no position in any stocks mentioned.
Have feedback on this article? Concerned about the content? Get in touch with us directly. Alternatively, email editorial-team@simplywallst.com