
- PRICING
- LIVE QUOTES
- LEARN
- HELP


EN
Carvana (CVNA) Stock Looks Fully Valued After Its 7x Run
Carvana stock has delivered a very large 3 year return while the broader valuation checks still lean expensive, which raises the question of how much of the story is already reflected in the current share price.
- Over 3 years, Carvana has returned close to 7x, which puts recent short term declines into context as part of a much larger move.
- Recent reports of market share gains in a flat used car market may support growth expectations, while new competitors such as Bidbus could pressure pricing power and margins that are important for the valuation case.
- Carvana scores 1 out of 6 on the valuation checks, which suggests the stock does not screen as a clear bargain on the broader metrics.
The stock's next move may depend on whether investors decide that this mix of strong past returns, competitive pressures and a low value score still justifies paying the current price for Carvana.
Find out why Carvana's -6.2% return over the last year is lagging behind its peers.
Has Carvana Run Too Far on Earnings?
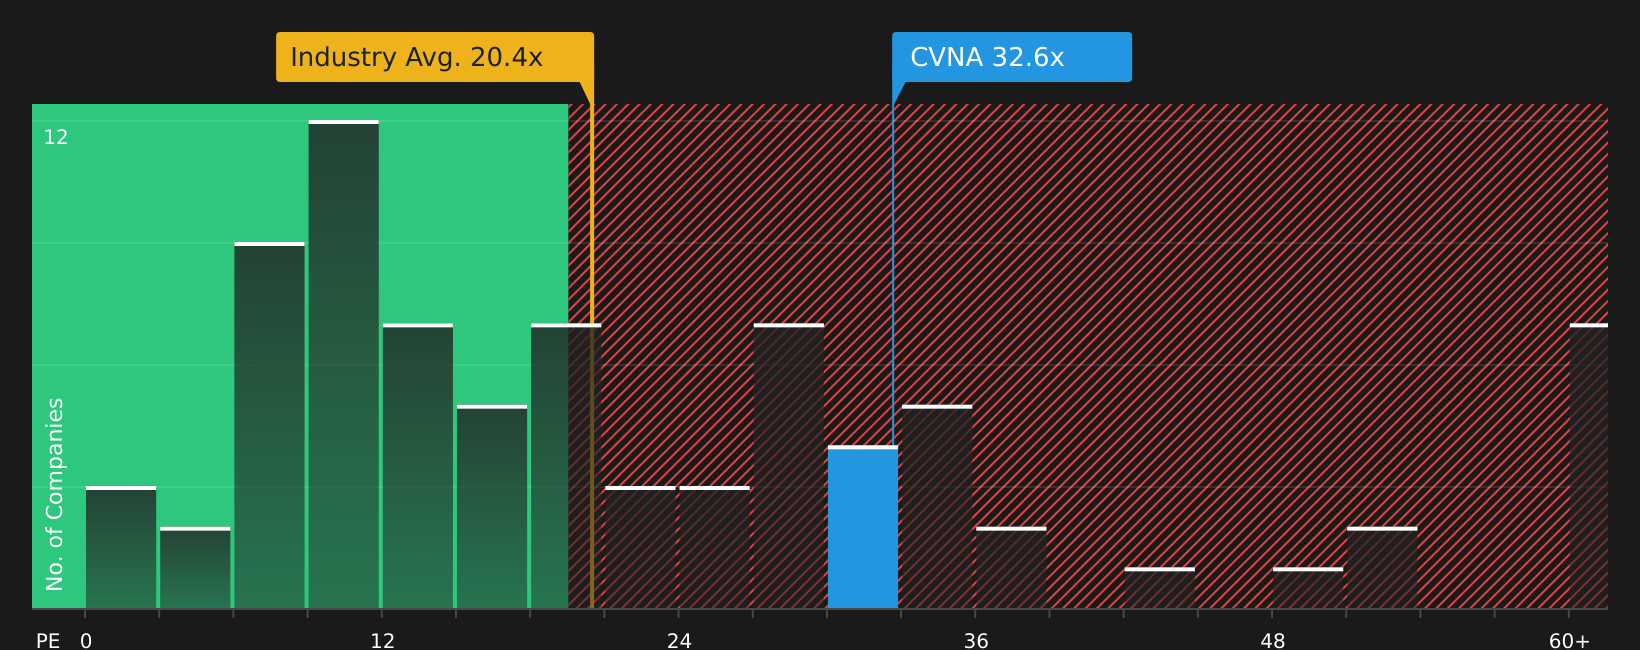
P/E is a useful lens for Carvana because investors are closely watching how current earnings support the recent share price recovery. Carvana trades on a P/E of 31.9x, compared with about 20.8x for the broader Specialty Retail industry and a peer average of 17.8x. This means the stock carries a clear premium to both its sector and closer direct comparisons.
The fair P/E implied by the broader assessment of Carvana, at 26.2x, sits meaningfully below the current 31.9x. This points to the stock looking overvalued on this measure. Recent headlines about Carvana gaining market share in a flat used car market help explain why investors are willing to pay a higher multiple, but they do not remove the gap between the trading multiple and this fair ratio benchmark.
On the P/E multiple, Carvana stock currently screens as overvalued relative to both tailored fair value estimates and typical industry levels.
See what the numbers say about this price — find out in our valuation breakdown.
The Carvana Narrative: What Would Justify Today's Price?
Simply Wall St Narratives for Carvana pick up where the P/E puzzle leaves off by spelling out which paths for Carvana's revenue growth, profit margins and earnings would need to play out for the stock to be worth materially more or less than it is today on the market. Instead of a single ratio or output, they lay out the future that number depends on so you can watch how Carvana's actual progress lines up over time.
Community views on Carvana sit far apart, with some investors focused on operating momentum while others concentrate on structural and accounting risks.
Bull case: 6% undervalued
"Carvana is demonstrating sustained rapid growth and expanding market share, selling 1.5% of all used cars in the U.S. with industry-leading year-over-year unit sales growth of 41%, suggesting strong long-term revenue and market share potential that could surpass current expectations..."
Read the full Bull Case to see why Carvana could be undervalued
Bear case: 6% undervalued
"There are growing concerns among some market observers that Carvana's business model may be masking deeper financial instability..."
Read the full Bear Case to see why Carvana could be overvalued
Do you think there's more to the story for Carvana? Head over to our Community to see what others are saying!
The Bottom Line
For Carvana, the current P/E premium and low overall value score point to a stock that already prices in a lot of optimism, with limited support from broader valuation checks. That does not settle the debate but it frames it clearly. The key question from here is whether Carvana can deliver the revenue growth and margin profile that keeps investors comfortable paying a richer multiple than peers, or whether expectations cool and the market resets the valuation closer to industry norms.
This article by Simply Wall St is general in nature. We provide commentary based on historical data and analyst forecasts only using an unbiased methodology and our articles are not intended to be financial advice. It does not constitute a recommendation to buy or sell any stock, and does not take account of your objectives, or your financial situation. We aim to bring you long-term focused analysis driven by fundamental data. Note that our analysis may not factor in the latest price-sensitive company announcements or qualitative material. Simply Wall St has no position in any stocks mentioned.
Have feedback on this article? Concerned about the content? Get in touch with us directly. Alternatively, email editorial-team@simplywallst.com