
- PRICING
- LIVE QUOTES
- LEARN
- HELP


EN
The “good news is bad news” spell has reappeared! The Citibank Economic Accident Index broke through 40, and US stocks may face a “three-week decline, three-month recovery of lost ground” pattern
The Zhitong Finance App learned that the US economy is showing resilience beyond expectations — a strong labor market, steady retail sales, and a recovery in regional manufacturing. However, for US stock investors, this “good news” is turning into actual “bad news.” Leuthold Group's latest research reveals an unsettling market pattern: when the Citigroup US Economic Accident Index breaks through the critical threshold of 40, the S&P 500 index often records negative gains within the next three weeks, and it takes an average of three months to recover lost ground. Currently, the index is as high as 50.3 — the “good news is bad news” spell is being repeated on Wall Street.
The law of history: the “three-week curse” that has been verified 28 times
Since Citigroup launched the Economic Accident Index in 2003, data tracked by Leuthold Group shows that when the “Main Street Economy” index reading reached 40 or above 28 times, the S&P 500 index recorded negative returns over the next 21 trading days. Each time, the market takes an average of three months to make up for these losses.
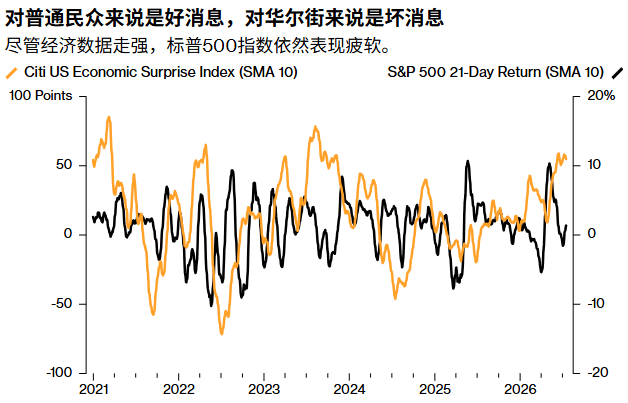
Chun Wang, director of multi-asset strategy at Leuthold, put it bluntly: “We have indeed noticed this change in market dynamics. Especially in the past two or three months, favorable news is often accompanied by weak stock market performance.” Behind this “good news is bad news” situation is a product of a combination of forces.
The Citibank Economic Accident Index has continued to be in a positive range since this year, but the recent drop in oil prices has further boosted the index. The index broke through 63 in June, the highest level since 2023. This means that the US economic data has exceeded expectations to a strength rarely seen in recent years.
The study provides a way to track investor sentiment. Investors are trying to maintain a balance between data that is neither too hot to stimulate inflation (which in turn causes a strong reaction from the Federal Reserve), nor too cold to slow economic growth.
Iran war: “extra noise” that breaks the laws of history
Wang specifically pointed out that the most notable variable in this round of “good news is bad news” phenomenon is the war in Iran. The “additional disruption” brought about by the military conflict between the US and Iran is the event that deviates the most from historical rules so far, and has had a significant impact on both oil prices and break-even interest rates.
The rise in oil prices itself is a kind of policy pressure — Jim Paulsen, chief investment strategist at Leuthold, previously discovered that there is a strong negative correlation between the Citibank Economic Accident Index and a policy pressure index that measures rising oil prices, rising 10-year US bond yields, and the strengthening of the US dollar (correlation coefficient as high as 0.7), and changes in the policy pressure index are often three months ahead of the economic accident index. This means that the current strong economic data may be a lagging reflection of the rise in oil prices and the accumulation of policy pressure three months ago.
Triple logic: Why strong data is toxic to the stock market
Logic 1: Overheating of the economy triggers fears of inflation and interest rate hikes
Strong economic data is a double-edged sword. Bob Lang, founder and chief strategist at Explosive Options, warned: “Monetary policy may shift next week and fall, reflecting the government taking a more active stance against inflation.” Markets worry that economic data that continues to exceed expectations will complicate the Federal Reserve's task of keeping the inflation rate within the 2% target range.
Although the June CPI and PPI data were both weaker than expected, which suppressed expectations of interest rate hikes at one point, the statements of Federal Reserve officials were still cautious. Chairman Walsh said that “mission accomplished” cannot be announced due to a lower CPI data; Governor Waller warned that if heated core inflation occurs again, the Federal Reserve may need to tighten its policy in the near future. Bank of America economists still expect the Federal Reserve to raise interest rates at the September, October, and December meetings, respectively.
Logic 2: The most optimistic scenario where the valuation is fully priced
Ken Mahoney, CEO of Mahoney Asset Management, pointed out that the stock market has accumulated a 17% increase since late March, and the current valuation may have reflected the most optimistic expectations. “The most optimistic results are probably already reflected in stock prices, and solid economic reports are now likely to put pressure on the stock market,” Mahoney said. “There is such an asymmetrical shift in how people interpret the news.”
Pressure signals at the valuation level are particularly prominent. On July 14, 2026, the PE-TTM of the S&P 500 was 28.35 times, which is in the position of 79.12% in the past ten years. If the profit margin of the S&P 500 index is lowered to the level of 2019, the index currently corresponds to a forward price-earnings ratio of about 27 times, which is already higher than the peak of about 26.5 times during the Internet bubble in March 2000. Schiller's price-earnings ratio of the S&P 500 index has surpassed 42 times, reaching about 2.4 times the long-term average (about 17.4 times).
Logic 3: The superposition effect of technology stock rotation and position reset
Sameer Samana, head of global equities and real assets at Wells Fargo Investment Research Institute, believes that S&P 500's recent struggles may have more to do with the continued rotation of technology and AI stocks. Citigroup strategist David Chew's team pointed out that the recent sell-off in AI and technology stocks has triggered extensive risk reduction operations, and the capital flow of large US stocks is overwhelmingly skewed. Position adjustments in the S&P 500 index are mainly based on closing long positions, while position adjustments in the Nasdaq index are characterized by a combination of more aggressive long positions and new short positions.
Citi warned that the elimination of US stock positions is far from over. The NASDAQ has lost money across the board and positions are still high, and there is still further pressure to close positions.
Investment advice: find a balance between prudence and optimism
Faced with a market environment where “good news is bad news”, Wang advises investors to be “extra cautious.” He said, “We have always believed that the stock market is the current economy, so due to the wealth effect, the stock market is the biggest risk facing the economy. In terms of asset allocation, in terms of attitude towards risky assets, we should adopt a compromise plan.” He added that although the short-term situation is “not too bad”, given the current situation, “extra caution” is needed in the future.
However, not all market participants are pessimistic. HSBC strategists previously warned that overheated market sentiment, weakening fiscal stimulus effects, and uncertainty brought about by the US midterm elections could all trigger a correction in the stock market. However, it was also pointed out that current market positions and sentiment indicators are close to the level of the 2021 economic restart period.
For investors, the current market environment raises a fundamental question: when economic data is stronger and the market is more vulnerable, the traditional “growth favors the stock market” logic is being disrupted. Until the Citibank Economic Accident Index falls from a high of 50.3, US stocks will probably still be under the spell of “good news is bad news.”