
- PRICING
- LIVE QUOTES
- LEARN
- HELP


EN
European Stocks Estimated To Be Trading Up To 49.4% Below Intrinsic Value
Amidst a backdrop of economic fluctuations and geopolitical tensions, the European market has shown resilience, with the STOXX Europe 600 Index ending a volatile week nearly unchanged. As investors navigate these uncertainties, identifying undervalued stocks becomes crucial; such stocks can offer potential opportunities when trading below their intrinsic value, especially in times of market volatility.
Top 10 Undervalued Stocks Based On Cash Flows In Europe
| Name | Current Price | Fair Value (Est) | Discount (Est) |
| VIGO Photonics (WSE:VGO) | PLN487.00 | PLN963.94 | 49.5% |
| Mips (OM:MIPS) | SEK378.00 | SEK745.85 | 49.3% |
| Hiab Oyj (HLSE:HIAB) | €53.65 | €106.37 | 49.6% |
| Hemnet Group (OM:HEM) | SEK85.45 | SEK168.84 | 49.4% |
| ERAMET (ENXTPA:ERA) | €42.18 | €83.52 | 49.5% |
| Endomines Finland Oyj (HLSE:PAMPALO) | €7.92 | €15.47 | 48.8% |
| Deutsche Beteiligungs (XTRA:DBAN) | €21.85 | €43.50 | 49.8% |
| Com.Tel (BIT:CMTL) | €1.87 | €3.70 | 49.5% |
| Casta Diva Group (BIT:CDG) | €3.05 | €6.05 | 49.6% |
| Cambi (OB:CAMBI) | NOK21.50 | NOK42.54 | 49.5% |
Let's explore several standout options from the results in the screener.
Hemnet Group (OM:HEM)
Overview: Hemnet Group AB (publ) operates a residential property platform in Sweden with a market cap of approximately SEK7.75 billion.
Operations: The company generates revenue from its Internet Information Providers segment, amounting to SEK1.33 billion.
Estimated Discount To Fair Value: 49.4%
Hemnet Group is trading at SEK85.45, significantly below its estimated future cash flow value of SEK168.84, indicating it may be undervalued by over 49%. Despite recent declines in revenue and net income, Hemnet's earnings are forecast to grow at 20.2% annually—outpacing the Swedish market's growth rate. The company has introduced innovative services like "Under-the-radar" listings and is executing a share buyback program to adjust its capital structure, potentially enhancing shareholder value.
- Insights from our recent growth report point to a promising forecast for Hemnet Group's business outlook.
- Navigate through the intricacies of Hemnet Group with our comprehensive financial health report here.

Idun Industrier (OM:IDUN B)
Overview: Idun Industrier AB (publ) is an investment holding company that focuses on investing in and developing industrial and service businesses across Sweden, the Nordic countries, Europe, and internationally, with a market cap of SEK3.65 billion.
Operations: The company's revenue is primarily derived from its Manufacturing segment, which accounts for SEK1.49 billion, and its Service & Maintenance segment, contributing SEK898 million.
Estimated Discount To Fair Value: 45.4%
Idun Industrier, trading at SEK317, is undervalued with an estimated future cash flow value of SEK580.64. The company has recently redeemed bonds early to optimize its capital structure, reducing interest expenses by approximately SEK8 million annually. Despite high debt levels, Idun's earnings grew by 55.7% last year and are expected to grow significantly over the next three years, outpacing the Swedish market's earnings growth rate of 7.5% per year.
- Our earnings growth report unveils the potential for significant increases in Idun Industrier's future results.
- Dive into the specifics of Idun Industrier here with our thorough financial health report.
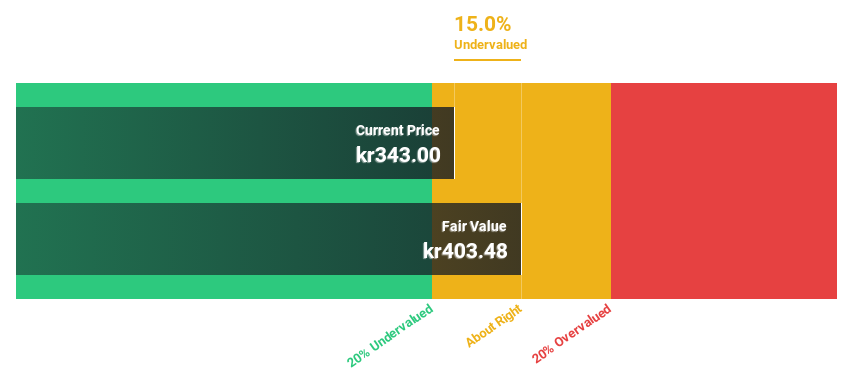
Wirtualna Polska Holding (WSE:WPL)
Overview: Wirtualna Polska Holding S.A., with a market cap of PLN1.76 billion, operates through its subsidiaries in the media, advertising, and e-commerce sectors in Poland.
Operations: The company generates revenue from segments including Travel (PLN1.40 billion), Consumer Finance (PLN247.62 million), and Advertising and Subscriptions (PLN708.12 million).
Estimated Discount To Fair Value: 35.2%
Wirtualna Polska Holding, trading at PLN59, is undervalued with a future cash flow value of PLN90.99, offering good relative value compared to peers. Despite a recent net loss of PLN16.87 million for Q1 2026, revenue rose to PLN555.24 million from the previous year's PLN371.95 million. Expected revenue growth of 6.3% annually surpasses the Polish market's 4.6%, though interest payments are not well covered by earnings and profitability is anticipated in three years.
- Our comprehensive growth report raises the possibility that Wirtualna Polska Holding is poised for substantial financial growth.
- Click here and access our complete balance sheet health report to understand the dynamics of Wirtualna Polska Holding.

Key Takeaways
- Unlock our comprehensive list of 200 Undervalued European Stocks Based On Cash Flows by clicking here.
- Got skin in the game with these stocks? Elevate how you manage them by using Simply Wall St's portfolio, where intuitive tools await to help optimize your investment outcomes.
- Maximize your investment potential with Simply Wall St, the comprehensive app that offers global market insights for free.
Searching for a Fresh Perspective?
- Explore high-performing small cap companies that haven't yet garnered significant analyst attention.
- Diversify your portfolio with solid dividend payers offering reliable income streams to weather potential market turbulence.
- Fuel your portfolio with companies showing strong growth potential, backed by optimistic outlooks both from analysts and management.
This article by Simply Wall St is general in nature. We provide commentary based on historical data and analyst forecasts only using an unbiased methodology and our articles are not intended to be financial advice. It does not constitute a recommendation to buy or sell any stock, and does not take account of your objectives, or your financial situation. We aim to bring you long-term focused analysis driven by fundamental data. Note that our analysis may not factor in the latest price-sensitive company announcements or qualitative material. Simply Wall St has no position in any stocks mentioned.
Have feedback on this article? Concerned about the content? Get in touch with us directly. Alternatively, email editorial-team@simplywallst.com