
- PRICING
- LIVE QUOTES
- LEARN
- HELP


EN
SMS (TSE:2175) Could Be 48% Undervalued As Valuation Signals Split
SMS stock: recent performance and business context
SMS (TSE:2175) has drawn attention after a strong run recently, with the stock up about 20% over the past month and roughly 37% in the past 3 months, prompting fresh interest in its underlying business.
The company focuses on information infrastructure for Japan’s aging society, with revenue of ¥64,735 and a reported loss of ¥14,317. This means investors are weighing solid annual revenue growth against ongoing profitability challenges.
See our latest analysis for SMS.
At a share price of ¥2,433.0, SMS has seen strong recent momentum, with an 80.22% year to date share price return contrasting with a weaker 3 year total shareholder return of a 5.98% decline and a 16.53% decline over 5 years.
If SMS’s recent move has you thinking about where else momentum and fundamentals may be lining up, it could be a good time to scan 11 top founder-led companies
SMS has a clear role in services for Japan’s aging society, and the share price has surged recently. This raises a sharper question: is that quality of business already fully reflected in today’s valuation?
Preferred Price-to-Sales multiple of 3.1x: Is it justified?
At the last close of ¥2,433.0, SMS is described as trading at a 3.1x Price-to-Sales (P/S) ratio. This screens as expensive versus both its Professional Services industry average of 0.9x and a peer average of 2.4x, even though internal modelling suggests headroom up to a fair P/S ratio of 4.3x.
The P/S multiple compares SMS's market value to its ¥64,735 of revenue, so you are effectively paying 3.1 times annual sales for each share at the current price. For a company that is still reporting a loss of ¥14,317, this metric helps frame what investors are paying for its revenue footprint in Japan's aging society services market.
Here the tension is clear. The stock is flagged as expensive relative to the wider JP Professional Services group and a closer peer set. Yet the SWS fair ratio work suggests the P/S level could be higher than today if the market moved closer to that regression based estimate. That contrast between a premium to peers and a discount to the fair P/S ratio is a key point for anyone judging whether current sentiment on SMS has run too far or is still catching up.
Explore the SWS fair ratio for SMS
Result: Price-to-Sales of 3.1x (UNDERVALUED)
However, SMS still carries clear risks, including the recent share price run ahead of analyst price targets, as well as ongoing losses despite revenue of ¥64,735.
Find out about the key risks to this SMS narrative.
Another view on SMS: what the DCF model says
The earlier discussion framed SMS as expensive on a 3.1x P/S ratio against industry and peer averages. Yet our DCF model points in a different direction, with a fair value estimate of ¥3,594 per share versus the current ¥2,433 price. This suggests the stock screens as undervalued on cash flow assumptions.
For investors, that split between a richer revenue multiple and an SWS DCF model that still indicates undervaluation raises a practical question. Which signal deserves more weight when current profits are absent but cash flows are modelled to improve?
Look into how the SWS DCF model arrives at its fair value.
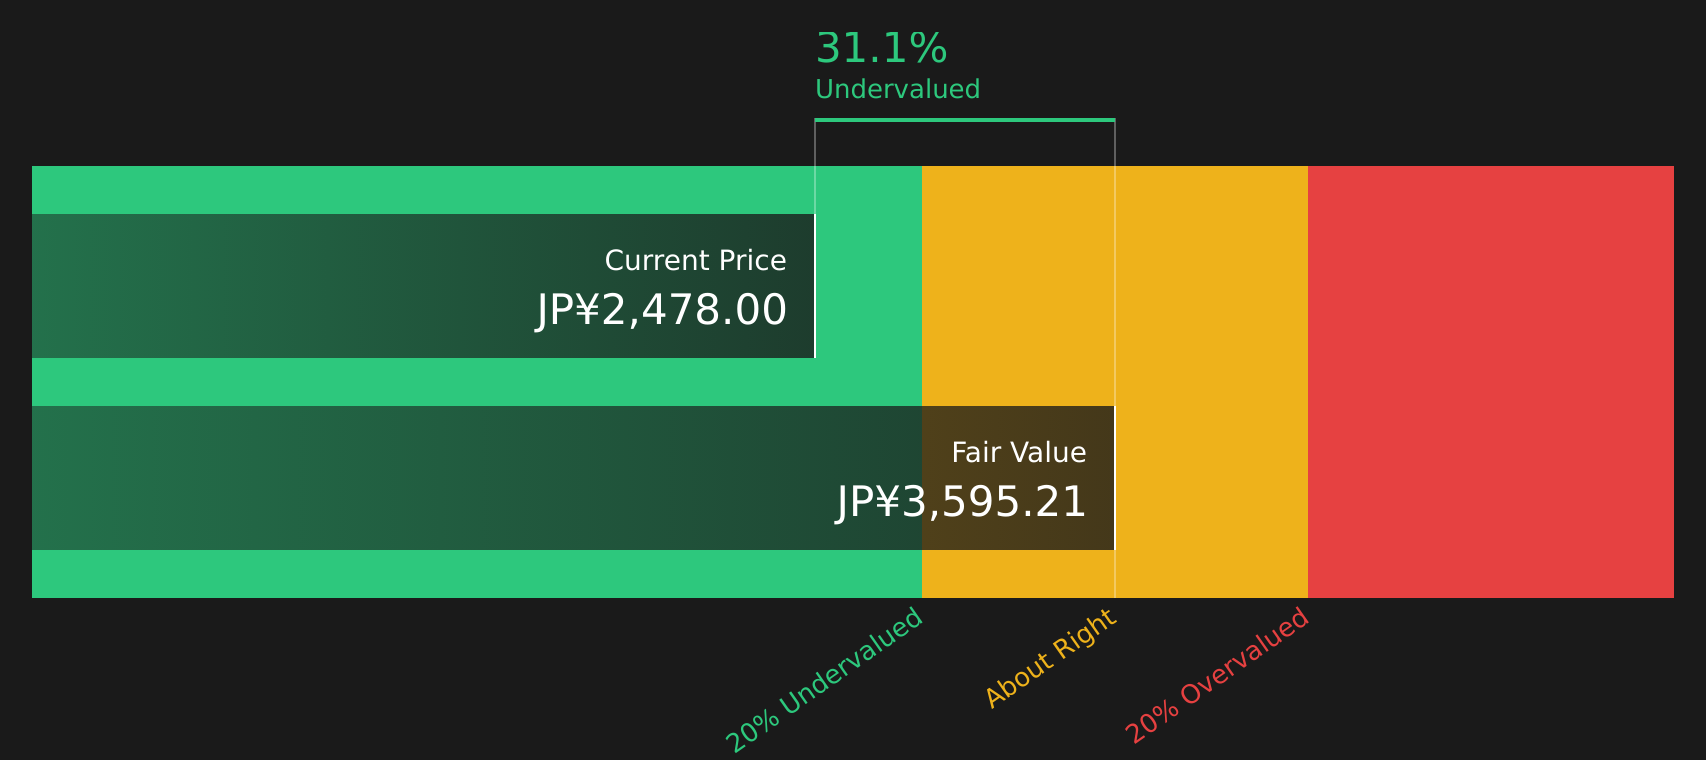
Simply Wall St performs a discounted cash flow (DCF) on every stock in the world every day (check out SMS for example). We show the entire calculation in full. You can track the result in your watchlist or portfolio and be alerted when this changes, or use our stock screener to discover 18 high quality undervalued stocks. If you save a screener we even alert you when new companies match - so you never miss a potential opportunity.
Next Steps
Given the mixed signals around SMS, it makes sense to move quickly, test the data for yourself and decide whether the optimism is warranted, then weigh those positives against the 2 key rewards.
Looking for more investment ideas beyond SMS?
If SMS has sharpened your thinking, do not stop there. Broaden your watchlist with focused stock ideas built from clear fundamentals and transparent data.
- Target resilient cash generators that still look out of favor by reviewing the 18 high quality undervalued stocks.
- Strengthen your income focus by scanning 48 dividend fortresses designed for investors who want yield with supporting fundamentals.
- Stay a step ahead of the crowd by checking the screener containing 61 high quality undiscovered gems before other investors start paying attention.
This article by Simply Wall St is general in nature. We provide commentary based on historical data and analyst forecasts only using an unbiased methodology and our articles are not intended to be financial advice. It does not constitute a recommendation to buy or sell any stock, and does not take account of your objectives, or your financial situation. We aim to bring you long-term focused analysis driven by fundamental data. Note that our analysis may not factor in the latest price-sensitive company announcements or qualitative material. Simply Wall St has no position in any stocks mentioned.
Have feedback on this article? Concerned about the content? Get in touch with us directly. Alternatively, email editorial-team@simplywallst.com