
- PRICING
- LIVE QUOTES
- LEARN
- HELP


EN
Denali Therapeutics (DNLI) Heads To Alzheimer’s Conference As Valuation Questions Return
Conference appearance puts Denali Therapeutics stock back in focus
Denali Therapeutics (DNLI) is set to present at the Alzheimer’s Association International Conference in London on July 12, 2026, with Co-Founder and CEO Ryan J. Watts scheduled as a featured speaker.
For investors watching Denali Therapeutics stock, this conference appearance focuses attention on the company’s Alzheimer’s research pipeline and its broader approach to neurodegenerative diseases, set against a market value near US$3.7b.
See our latest analysis for Denali Therapeutics.
Denali Therapeutics shares trade at US$23.29, with short term share price returns mixed, including a 7 day decline of 9.31%, while the 1 year total shareholder return of 66.36% contrasts with a 5 year total shareholder return decline of 63.55%. This suggests momentum has recently strengthened after a weaker longer term period.
If this Alzheimer’s conference appearance has you thinking about where else progress in healthcare AI might show up in the market, it could be worth scanning 39 healthcare AI stocks
After Denali Therapeutics jumped over the past year yet still trades roughly 47% below the average analyst price target, the gap between market price and valuation models is hard to ignore. Where does a reasonable fair value range sit now?
Price to book of 4x for Denali Therapeutics: Is it justified?
On a P/B basis, Denali Therapeutics trades at about 4x book value, which screens as cheaper than its direct peers but more expensive than the broader US biotech industry.
The price to book ratio compares the company’s market value to its net assets on the balance sheet. It is often used for early stage or unprofitable biopharma stocks where earnings are not yet a reliable yardstick. With Denali Therapeutics still reporting a loss of $508.02m and making less than $1m in revenue, investors are effectively paying for its asset base, pipeline and future potential rather than current profitability.
Relative to a peer average P/B of 10x, the stock looks lowly priced against similar companies, which suggests the market is not assigning the same level of optimism as it does to that group. Against the wider US biotech industry average of 2.6x, however, Denali Therapeutics sits at a premium, which points to investors being willing to pay more than the sector norm for its balance sheet and pipeline.
See what the numbers say about this price — find out in our valuation breakdown.
Result: Price to book ratio of 4x (ABOUT RIGHT)
However, the story for Denali Therapeutics could be knocked off course if key pipeline trials disappoint or if ongoing losses of around US$508m strain its balance sheet.
Find out about the key risks to this Denali Therapeutics narrative.
Another view on Denali Therapeutics valuation
While the 4x P/B suggests Denali Therapeutics sits somewhere between peers and the wider biotech sector, the SWS DCF model points in a different direction. It shows an estimate of future cash flow value around $21.18 versus the current $23.29 share price, implying the stock screens as slightly overvalued on this lens.
That kind of gap is not huge, but it does raise a practical question for investors: which signal carries more weight here, the balance sheet comparison or the cash flow model?
Look into how the SWS DCF model arrives at its fair value.
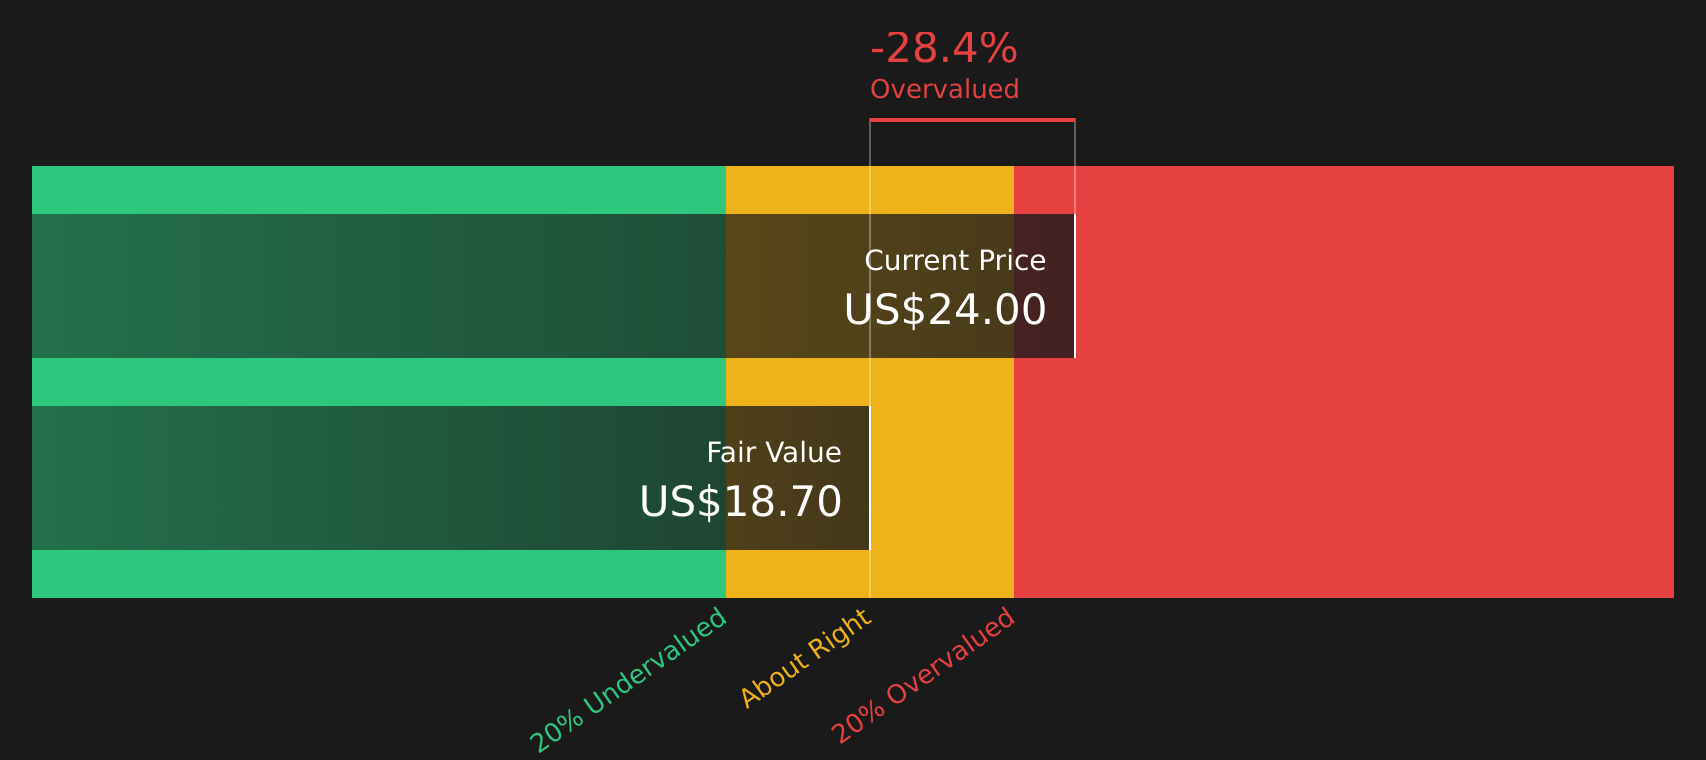
Simply Wall St performs a discounted cash flow (DCF) on every stock in the world every day (check out Denali Therapeutics for example). We show the entire calculation in full. You can track the result in your watchlist or portfolio and be alerted when this changes, or use our stock screener to discover 47 high quality undervalued stocks. If you save a screener we even alert you when new companies match - so you never miss a potential opportunity.
Next Steps
With mixed signals across Denali Therapeutics’ valuation tools, the key issue is how you weigh the risks against the potential rewards. Act promptly, review the underlying data, and shape your own stance by checking the 1 key reward and 2 important warning signs
Looking for more investment ideas beyond Denali Therapeutics?
If tracking Denali Therapeutics has sharpened your focus, do not stop here. Broaden your watchlist now using Simply Wall Street tools that highlight different strengths.
- Target potential value opportunities by reviewing companies that screen as high quality yet priced attractively through the 47 high quality undervalued stocks.
- Strengthen your focus on resilience by filtering for businesses that show robust finances with the solid balance sheet and fundamentals stocks screener (47 results).
- Get ahead of the crowd by scanning a screener containing 20 high quality undiscovered gems that may not yet be widely followed but show strong underlying fundamentals.
This article by Simply Wall St is general in nature. We provide commentary based on historical data and analyst forecasts only using an unbiased methodology and our articles are not intended to be financial advice. It does not constitute a recommendation to buy or sell any stock, and does not take account of your objectives, or your financial situation. We aim to bring you long-term focused analysis driven by fundamental data. Note that our analysis may not factor in the latest price-sensitive company announcements or qualitative material. Simply Wall St has no position in any stocks mentioned.
Have feedback on this article? Concerned about the content? Get in touch with us directly. Alternatively, email editorial-team@simplywallst.com