
- PRICING
- LIVE QUOTES
- LEARN
- HELP


EN
How Investors May Respond To Enerpac Tool Group (EPAC) Q3 Results And Refined 2026 Sales Guidance
- Enerpac Tool Group Corp. recently reported past third-quarter 2026 results showing year-over-year growth in sales to US$167.55 million and net income to US$29.8 million, while also completing a US$80.44 million buyback of 2,078,645 shares announced in October 2025.
- The company also slightly refined its full-year 2026 net sales outlook to a US$635 million–US$645 million range, highlighting management’s focus on calibrating expectations alongside improving earnings per share.
- We’ll now examine how Enerpac’s refined 2026 sales guidance reshapes its investment narrative in light of recent operating performance.
AI is about to change healthcare. These 39 stocks are working on everything from early diagnostics to drug discovery. The best part - they are all under $10b in market cap - there's still time to get in early.
What Is Enerpac Tool Group's Investment Narrative?
To own Enerpac Tool Group, you need to be comfortable with a relatively steady industrial story where disciplined capital allocation does some of the heavy lifting. The latest quarter showed higher sales and earnings, and management nudged full-year sales guidance slightly tighter while outlining US$132 million to US$139 million of operating profit for 2026. That refinement looks more like fine tuning than a reset, so it does not radically change near term catalysts, which still hinge on execution, margin resilience and how effectively the company converts its solid Return on Equity into per share earnings. The completed US$80.44 million buyback, retiring just under 4% of the share base, supports that per share focus, but it also raises the stakes if earnings growth slows or industrial demand softens.
However, investors should watch how the lower profit guidance interacts with this heavier use of cash. Despite retreating, Enerpac Tool Group's shares might still be trading 20% above their fair value. Discover the potential downside here.Exploring Other Perspectives
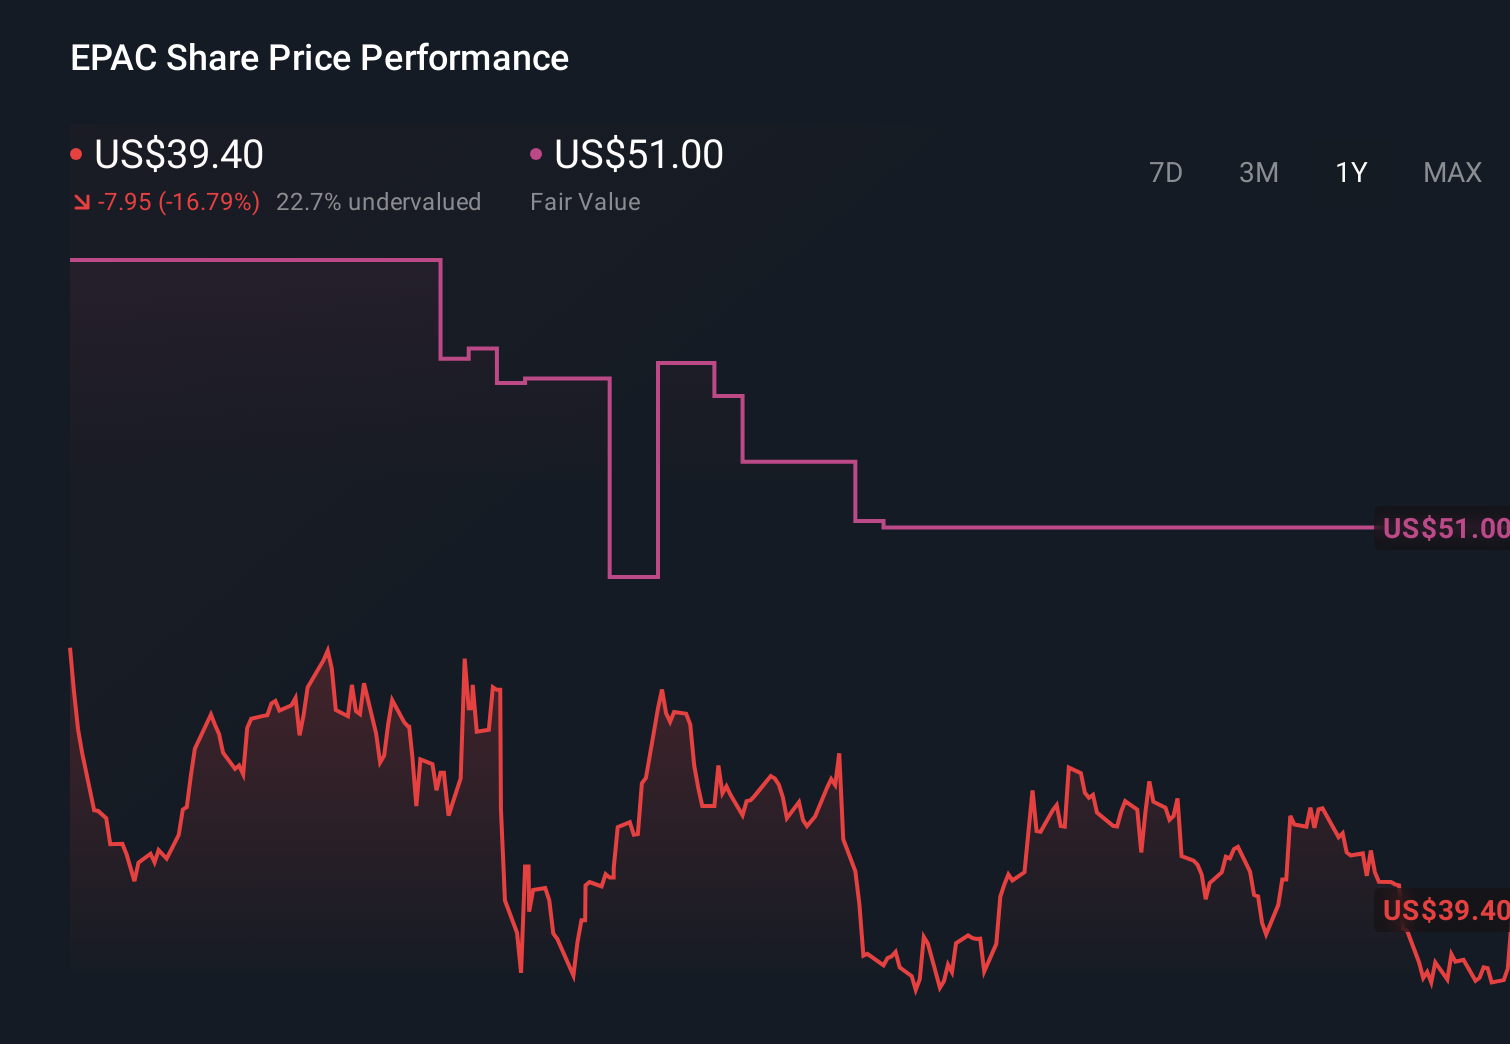
Explore 3 other fair value estimates on Enerpac Tool Group - why the stock might be worth just $39.11!
Reach Your Own Conclusion
Don't just follow the ticker - dig into the data and build a conviction that's truly your own.
- A great starting point for your Enerpac Tool Group research is our analysis highlighting 4 key rewards that could impact your investment decision.
- Our free Enerpac Tool Group research report provides a comprehensive fundamental analysis summarized in a single visual - the Snowflake - making it easy to evaluate Enerpac Tool Group's overall financial health at a glance.
Contemplating Other Strategies?
Opportunities like this don't last. These are today's most promising picks. Check them out now:
- Explore 26 top quantum computing companies leading the revolution in next-gen technology and shaping the future with breakthroughs in quantum algorithms, superconducting qubits, and cutting-edge research.
- Rare earth metals are the new gold rush. Find out which 29 stocks are leading the charge.
- The future of work is here. Discover the 33 top robotics and automation stocks leading the charge in AI-driven automation and industrial transformation.
This article by Simply Wall St is general in nature. We provide commentary based on historical data and analyst forecasts only using an unbiased methodology and our articles are not intended to be financial advice. It does not constitute a recommendation to buy or sell any stock, and does not take account of your objectives, or your financial situation. We aim to bring you long-term focused analysis driven by fundamental data. Note that our analysis may not factor in the latest price-sensitive company announcements or qualitative material. Simply Wall St has no position in any stocks mentioned.
Have feedback on this article? Concerned about the content? Get in touch with us directly. Alternatively, email editorial-team@simplywallst.com