
- PRICING
- LIVE QUOTES
- LEARN
- HELP


EN
Storebrand (OB:STB) As Fresh Earnings Keep Valuation In Focus
How Storebrand’s latest earnings are shaping investor focus
Storebrand (OB:STB) has come into focus after reporting second quarter 2026 results, with net income of NOK 1,431 million and earnings per share of NOK 3.38 from continuing operations.
For the first half of 2026, the company reported net income of NOK 2,025 million and basic earnings per share from continuing operations of NOK 4.77, prompting fresh attention on how the stock reflects these mixed time frames.
See our latest analysis for Storebrand.
Storebrand’s latest share price of NOK195.9 sits alongside a 30 day share price return of 9.81% and a year to date share price return of 14.43%. The 1 year total shareholder return of 36.85% and 5 year total shareholder return of 216.69% indicate that momentum has been building over time around the company’s earnings story and changing risk perceptions.
If Storebrand’s performance has caught your attention, this could be a good moment to broaden your search and check out 106 top founder-led companies
Storebrand’s latest report shows a solid insurance and pensions business attracting stronger market attention, yet the share price has already moved sharply higher. How does that stack up against what the stock looks worth today?
Price to earnings of 16.9x, is it justified for Storebrand?
On recent metrics, Storebrand trades on a P/E of 16.9x, which sits above both its peer group and the broader European insurance sector, even as the share price reflects a strong run over recent years.
The P/E ratio compares the company’s share price with its earnings per share, so a higher figure usually means investors are willing to pay more today for each unit of current earnings. For a diversified insurance and pensions group like Storebrand, that often reflects expectations about the stability of its earnings profile and how those earnings might develop over time, rather than just the latest quarter.
Here, the data paints a mixed picture. Storebrand’s earnings have grown by 13.7% per year over the past 5 years, yet profit growth over the most recent year, at 5%, sits below that longer term pace and also trails the wider insurance industry figure of 16.8%. Analysts also expect earnings to grow, but not significantly, with forecasts of around 7.3% per year, while revenue is expected to decline over the next 3 years. Against that backdrop, a P/E of 16.9x looks expensive versus the peer average of 12.2x and the European insurance average of 13.1x. However, it is closer to an estimated “fair” P/E of 18x that is implied by a separate fair ratio model.
Relative to sector peers, Storebrand appears priced at a premium multiple that suggests the market is attributing extra value to its earnings quality and track record, even though recent margin trends and forecast revenue direction are more subdued. If sentiment or growth expectations were to cool, that premium could have scope to narrow towards the 18x fair P/E level identified by the model, or potentially closer to industry averages, depending on how investors reassess the balance between earnings growth, margins and risk.
Explore the SWS fair ratio for Storebrand
Result: Price to earnings of 16.9x (OVERVALUED)
However, Storebrand’s premium P/E sits alongside annual revenue growth that has declined 83.59% and a value score of 3, which could challenge the case for a sustained valuation premium.
Find out about the key risks to this Storebrand narrative.
Another view on Storebrand’s valuation
While the P/E of 16.9x makes Storebrand look expensive versus peers, the SWS DCF model points in a different direction. On that view, the stock at NOK195.9 trades around 38.1% below an estimated fair value of NOK316.35, which suggests a very different risk and reward balance.
When two methods disagree this clearly, it pays to ask which assumptions you trust more: the earnings multiple or the cash flow path.
Look into how the SWS DCF model arrives at its fair value.
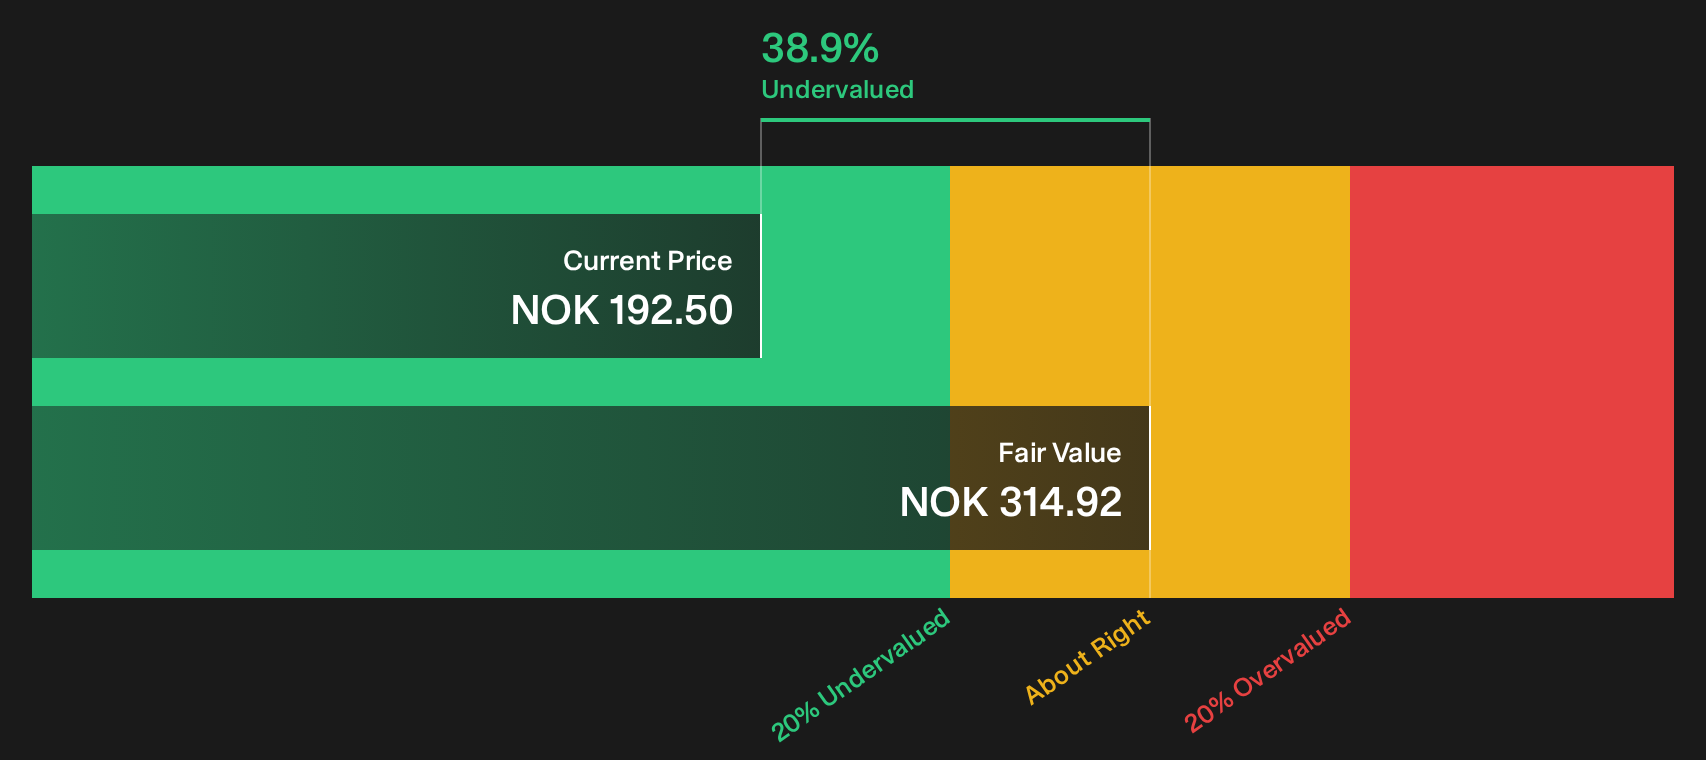
Simply Wall St performs a discounted cash flow (DCF) on every stock in the world every day (check out Storebrand for example). We show the entire calculation in full. You can track the result in your watchlist or portfolio and be alerted when this changes, or use our stock screener to discover 231 high quality undervalued stocks. If you save a screener we even alert you when new companies match - so you never miss a potential opportunity.
Next Steps
With Storebrand presenting both appealing metrics and some areas of concern, this is a moment to move quickly, weigh the trade offs, and see how the 3 key rewards and 2 important warning signs fits with your own view.
Looking for more investment ideas beyond Storebrand?
If Storebrand has sharpened your focus on valuation and quality, do not stop here. Use the Simply Wall St Screener to uncover more targeted opportunities.
- Zero in on resilient balance sheets and steady fundamentals with the solid balance sheet and fundamentals stocks screener (416 results) so potential weak spots in financial strength do not catch you off guard.
- Spot potential value opportunities early by scanning 231 high quality undervalued stocks that combine stronger cash flows with more conservative pricing.
- Hunt for under the radar prospects by running the screener containing 511 high quality undiscovered gems before other investors start paying closer attention.
This article by Simply Wall St is general in nature. We provide commentary based on historical data and analyst forecasts only using an unbiased methodology and our articles are not intended to be financial advice. It does not constitute a recommendation to buy or sell any stock, and does not take account of your objectives, or your financial situation. We aim to bring you long-term focused analysis driven by fundamental data. Note that our analysis may not factor in the latest price-sensitive company announcements or qualitative material. Simply Wall St has no position in any stocks mentioned.
Have feedback on this article? Concerned about the content? Get in touch with us directly. Alternatively, email editorial-team@simplywallst.com